Dynamically scale your workload with Keda

Context
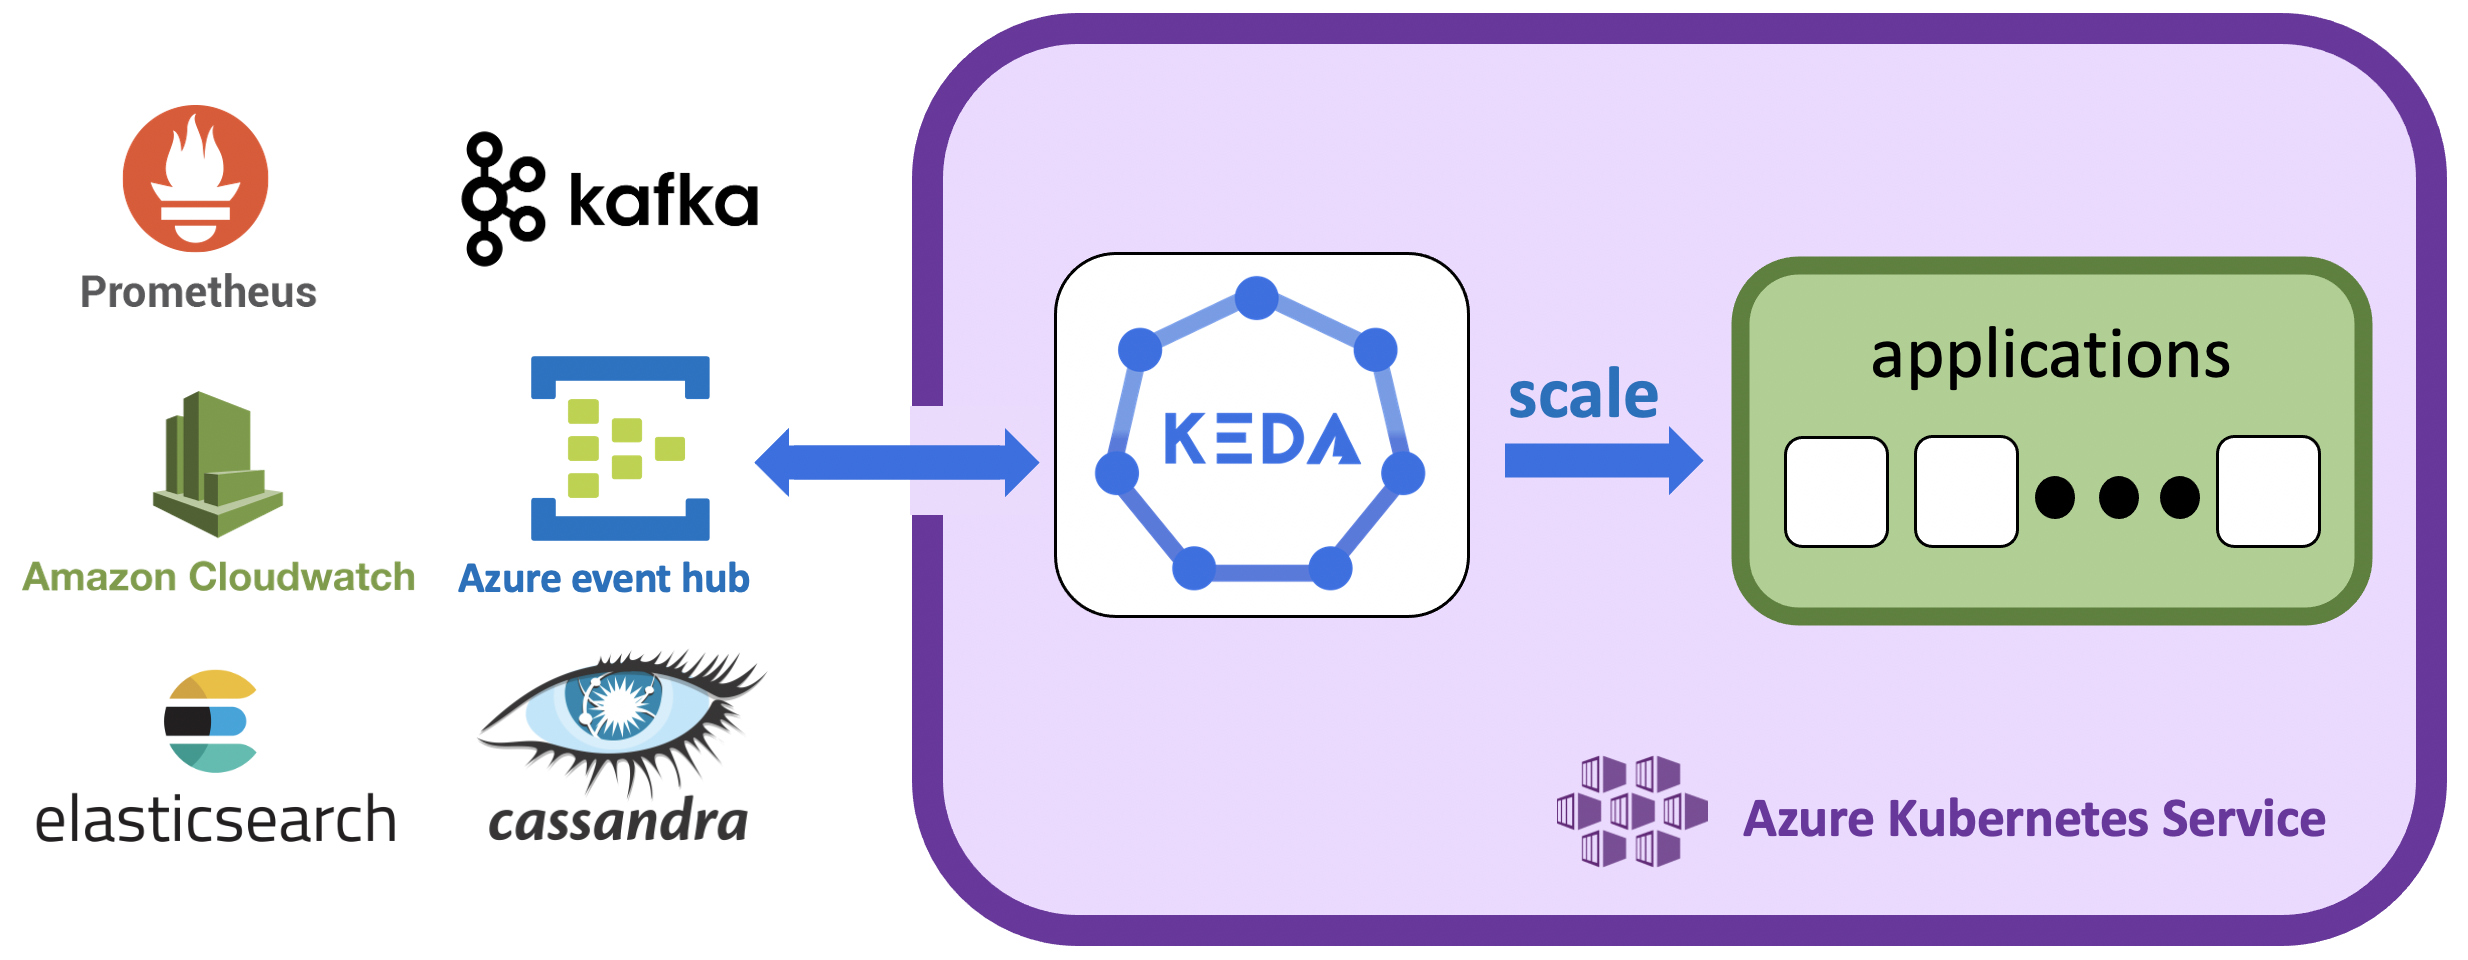
KEDA auto-scales your applications according to the metrics that matters to you !
The History of scaling in Kubernetes
Kubernetes clusters can scale in one of two ways:
- The cluster autoscaler watches for pods that can't be scheduled on nodes because of resource constraints. The cluster then automatically increases the number of nodes;
- The Horizontal Pod Autoscaler (HPA) uses the Metrics Server in a Kubernetes cluster to monitor the resource demand of pods. If an application needs more resources, the number of pods is automatically increased to meet the demand.
Both the HPA and cluster autoscaler can also decrease the number of pods and nodes as needed. The cluster autoscaler decreases the number of nodes when there has been unused capacity for a period of time, whereas HPA do it when resource consumption lowers.
HPA is great, but it does have limitations:
- It only scales according to the pods resources. If you wants to use other metrics, you'll have to use an Adapter;
- Only one Adapter can be used at a time. If you want to use several external resources, then you'll have to merge the metrics into one source beforehand.
KEDA has been created as an answer to these limitations.
KEDA
"Focus on scaling your app, not the scaling internal"
KEDA is a single-purpose and lightweight component that can be added into any Kubernetes cluster.
It offers an abstraction to HPA so that autoscaling according to resources from various sources becomes easy.
It introduces more than 30 built-in scalers so that the most common ways to get metrics are alreay implemented. Il is also really easy to build its own custom one if needed.
On top of that, KEDA can automatically scale any resources with the /scale subresource, such as deployments or jobs. It also brings the possibility to scales down to zero to only consume the needed resources.
The full list of KEDA built-in scalers can be find here
Under the hood, KEDA still uses HPA with an event-driven mindset that make it really useful and valuable.
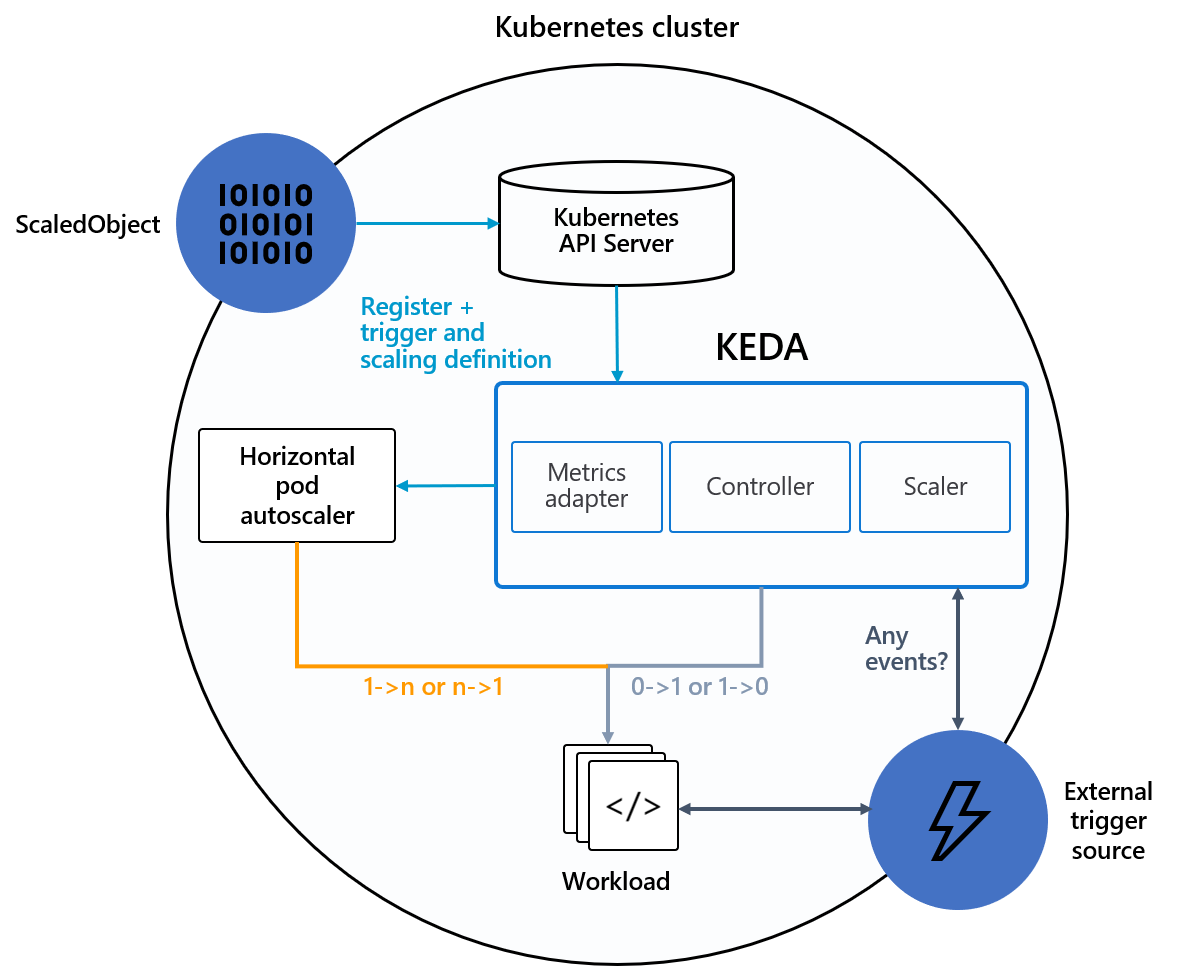
For more information, the KEDA website has a clear and easy-to-understand explanation video on its frontpage
Key Takeway points
Here are the main pros and cons of KEDA to remember:

KEDA is an open-source project, managed by the community. It have been originally created by Microsoft and Redhat.

KEDA takes away all the scaling infrastructure and manages everything for you.

KEDA is a single-purposed and lightweight component that can be added to any Kubernetes cluster.

The KEDA Metrics Server exposes a variety of metrics that can be queried directly with the Kubernetes command line.

They are about 50 scalers already available within KEDA and it's really easy to create your own.

KEDA extends Kubernetes functionalities without overwriting or application.

Understanding your infrastructure and selecting the right metrics for KEDA is the key to its success.

As all horizontal scalers, KEDA will scale within the limit of the cluster resources. One of the solution nfor this, may be to pair it with the Kubernetes auto-scaler to scale Kubernetes nodes as well.
Use case scenarios
To demonstrate the value and ease of use of KEDA in a production environment, here are two step by step real-world scenarios:
- Use case 1: Keda + Redis: A Video editing company wants to scale its application according to the number of messages in a queue;
- Use case 2: Keda + Prometheus: A finance company wants to scale its application according to the rate of requests received by it.
Prerequisites
You should have an Azure Kubernetes Service running and be logged into it.
It is also better to set yourself in a dedicated local folder, as we are going to create an execute several files during these tutorials.
Use case 1: Video editing company
A growing video editing company provides a cloud-based video rendering service.
Usage of its client application peaks at various times during a 24-hr period. Due to increasing and decreasing demand, the company needs to scale its application accordingly to provide a better experience to all customers. Since the application is event-driven and receives a significant number of events at various times; CPU and Memory based metrics are not representative of pending work to scale properly. As the DevOps engineer, you need to assess which tools will help achieve the company's scaling needs.
After experimenting with various options, you've determined that using Azure Kubernetes Services (AKS) and KEDA fulfills all the requirements to scale for peak and off-peak usage. With clearance from leadership, you begin the journey of an event driven application that supports the company now and in the future!
In this module, we'll deploy KEDA into an AKS environment and deploy a scaler object to autoscale containers based on the number of messages (events) in a list.
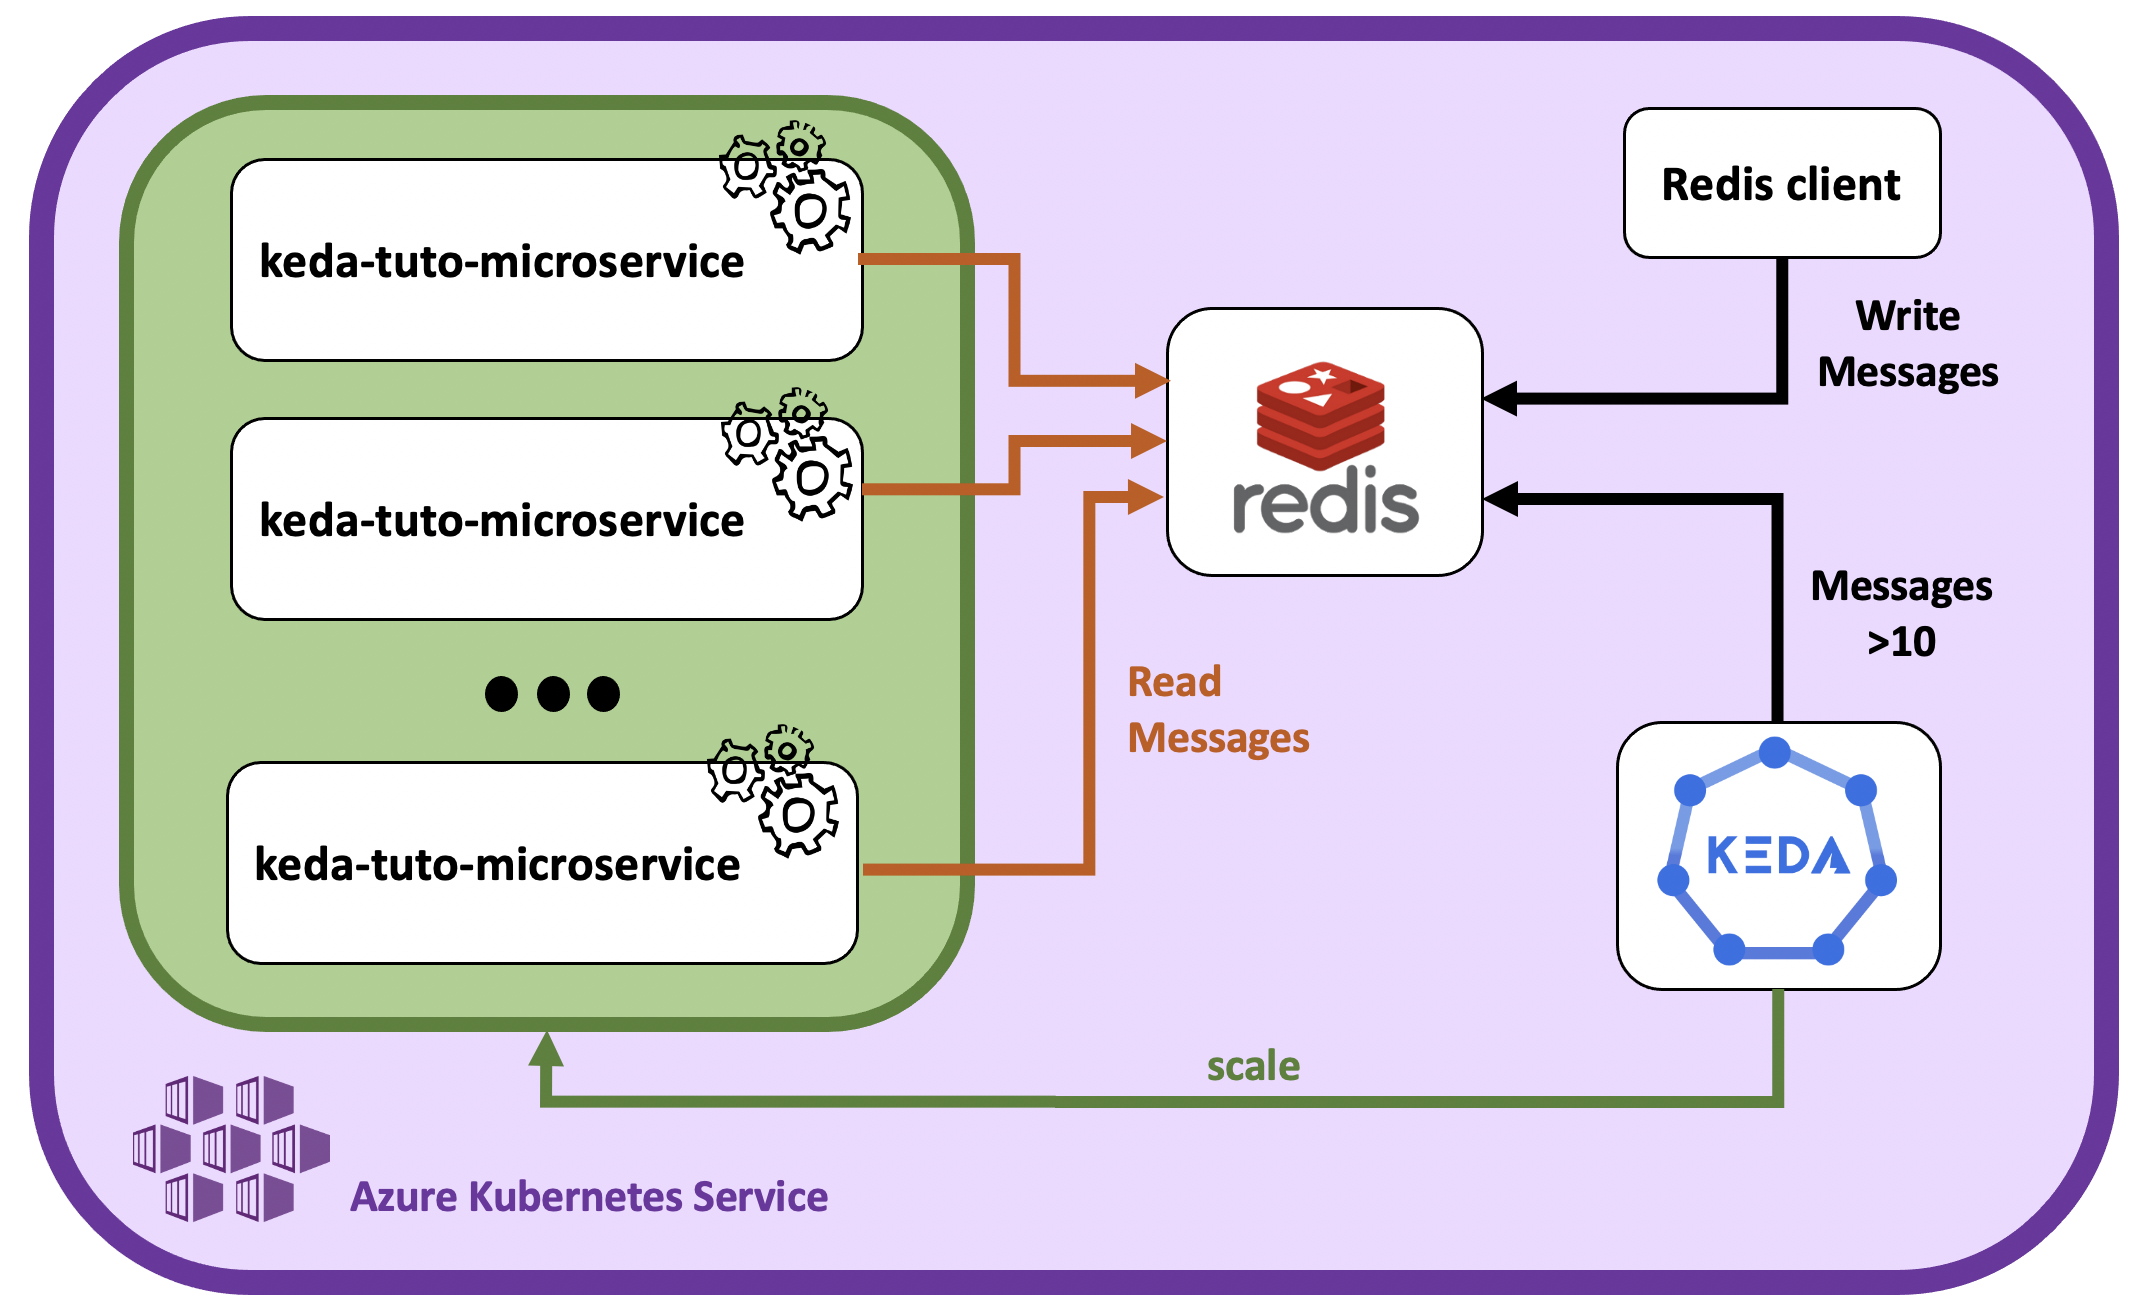
The scenario will include the following steps:
- Install KEDA: Set up KEDA in your cluster;
- Install Redis: Install Redis and create a list;
- Deploy the microservice app: Deploy a microservice app listening to Redis;
- Scale with KEDA according to the Redis queue: Use KEDA to scale the application pods according to the messages available in the Redis list;
- See KEDA in action: Play with the Redis list and observe the pods status;
- Summary: Conclusion on the use if KEDA in this context;
- Clean up: Clean up the deployed resources.
Install KEDA
Ask the K8saas team to deploy KEDA to your cluster.
Once installed, it's running, but not used, as no triggers has been defined yet.
Install Redis
Redis is the database from which the app gets its messages and that the KEDA scaler object will use to scale the application pods.
Install Redis as a standalone instance using the official helm chart:
helm repo add bitnami https://charts.bitnami.com/bitnami
helm install redis-keda-tuto --set architecture=standalone bitnami/redis --version 15.7.1 --set tls.authClients=false --set tls.enabled=false --set serviceAccount.create=false
Check the deployment success:
$ kubectl get pods
redis-keda-tuto-master-0                          2/2     Running   0          3m21s

$ kubectl get secret
redis-keda-tuto                         Opaque                                1      2m7s
Now that a Redis instance is set-up, let's start a client and connect to the database to create and populate a list.
First, deploy a client and connect to redis:
$ export REDIS_PASSWORD=$(kubectl get secret --namespace dev redis-keda-tuto -o jsonpath="{.data.redis-password}" | base64 --decode)
$ kubectl run --namespace dev redis-client --restart='Never'  --env REDIS_PASSWORD=$REDIS_PASSWORD  --image docker.io/bitnami/redis:6.2.6-debian-10-r90 --command -- sleep infinity
$ kubectl exec --tty -i redis-client --namespace dev -- bash
I have no name!@redis-client:/$ REDISCLI_AUTH="$REDIS_PASSWORD" redis-cli -h redis-keda-tuto-master
redis-keda-tuto-master:6379>
Now that we are in, let's create a list of random items:
redis-keda-tuto-master:6379> lpush keda Lorem ipsum dolor sit amet, consectetur adipiscing elit. Mauris eget interdum felis, ac ultricies nulla. Fusce vehicula mattis laoreet. Quisque facilisis bibendum dui, at scelerisque nulla hendrerit sed. Sed rutrum augue arcu, id maximus felis sollicitudin eget. Curabitur non libero rhoncus, pellentesque orci a, tincidunt sapien. Suspendisse laoreet vulputate sagittis. Vivamus ac magna lacus. Etiam sagittis facilisis dictum. Phasellus faucibus sagittis libero, ac semper lorem commodo in. Quisque tortor lorem, sollicitudin non odio sit amet, finibus molestie eros. Proin aliquam laoreet eros, sed dapibus tortor euismod quis. Maecenas sed viverra sem, at porta sapien. Sed sollicitudin arcu leo, vitae elementum
(integer) 100
Check once last time that an hundred messages has been added to the list "keda", and exit the pod :
redis-keda-tuto-master:6379> llen keda
(integer) 100
redis-keda-tuto-master:6379> exit
I have no name!@redis-client:/$ exit
Now that the list of messages is ready, let's deploy a microservice that consumes these messages.
Deploy the microservice app
Here, we'll use the official azure redis-client image to listen and consume messages on the recently created keda list.
First, enter the following command and note your REDIS password:
$ echo $REDIS_PASSWORD
************
Then, create a file named kedatutorial_microservice.yml, with the following content:
apiVersion: apps/v1
kind: Deployment
metadata:
  name: kedatutorial-microservice
spec:
  replicas: 1               # here we are telling K8S the number of containers to process the Redis list items
  selector:                     # Define the wrapping strategy
    matchLabels:                # Match all pods with the defined labels
      app: kedatutorial-microservice # Labels follow the `name: value` template
  template:                     # This is the template of the pod inside the Deployment
    metadata:
      labels:
        app: kedatutorial-microservice
    spec:
      containers:
        - image: mcr.microsoft.com/mslearn/samples/redis-client:latest
          name: kedatutorial-microservice
          resources:
            requests:
              cpu: 100m
              memory: 128Mi
            limits:
              cpu: 100m
              memory: 128Mi
          env:
            - name: REDIS_HOST
              value: "redis-keda-tuto-master"
            - name: REDIS_PORT
              value: "6379"
            - name: REDIS_LIST
              value: "keda"
            - name: REDIS_KEY
              value: "**********"  # *** REPLACE with your password value ***
Make sure to replace the REDIS_KEY value by your Redis password recovered earlier.
Run the kubectl apply command:
kubectl apply -f ./kedatutorial_microservice.yml
And finally, let's check if the pods are running:
$ kubectl get pods
keda-tuto-client-864b4d8df6-95fkt                  2/2     Running   0          57s
Scale with KEDA according to the redis queue
This is where we will see what KEDA can do. We will create a ScaledObject to scale based on the number of items in Redis list. Before we apply the manifest, let's dissect the key sections of the spec.
Two objects are created. First a TriggersAuthentification object that will go and read the Redis secret to find the password, with one important setion:
- secretTargetRef: section to go find a value within a secret object. name is the name of the secret, key is the name of the key within the secret, and parameter the name of the scaleObject parameter to set the value to:
spec:
  secretTargetRef:
  - parameter: password
    name: redis-keda-tuto
    key: redis-password
Then the ScaleObject itself, with the following parameters:
- scaleTargetRef: this section describes which workload KEDA observes. In our Deployment manifest from above we use the following values to tie the scaled object to the Deployment:
scaleTargetRef:
    apiVersion: apps/v1    # Optional. Default: apps/v1
    kind: deployment       # Optional. Default: Deployment
    name: kedatutorial-microservice # Mandatory. Must be in the same namespace as the ScaledObject
- minReplicaCount and maxReplicaCount: these two attributes determine the range of replicas KEDA uses for scaling. In our case, we instruct KEDA to scale from a minimum of zero with a max of ten:
minReplicaCount: 0   # Optional. Default: 0
maxReplicaCount: 10  # Optional. Default: 100
Note: minReplicaCount: 0 will take our Deployment default replica count from one to zero. This will occur if the service is idle and not processing any events. In this exercise, if there are no items in the Redis list, and the service remains idle, KEDA will scale to zero.
- triggers: this section uses scalers to detect if the object should be activated or deactivated, and feed custom metrics for a specific event source. For our example, we use the Redis scaler to connect the Redis instance and to the Redis list. The important metric in this scaler is listLength. This instructs KEDA to scale up when there are ten items in the list. And in order to connect to Redis, we'll use the TriggersAuthentification to recover the password:
triggers:
- type: redis
  metadata:
    address:  redis-keda-tuto-master.dev.svc.cluster.local:6379          # Format must be host:port
    listName: keda        # Required
    listLength: "10"      # Required
    enableTLS: "false"    # optional
    databaseIndex: "0"    # optional
  authenticationRef:
    name: keda-trigger-auth-redis-secret
For detailed information on available scalers see the documentation at the KEDA site.
Now, let's finally gather all those parts in a new file: kedatutorial_scaledobject.yml:
apiVersion: keda.sh/v1alpha1
kind: TriggerAuthentication
metadata:
  name: keda-trigger-auth-redis-secret
  namespace: dev
spec:
  secretTargetRef:
  - parameter: password
    name: redis-keda-tuto
    key: redis-password
---
apiVersion: keda.sh/v1alpha1
kind: ScaledObject
metadata:
  name: scaled-keda-tuto
spec:
  scaleTargetRef:
    apiVersion: apps/v1                             # Optional. Default: apps/v1
    kind: deployment                                # Optional. Default: Deployment
    name: kedatutorial-microservice                          # Mandatory. Must be in the same namespace as the ScaledObject
  pollingInterval: 30                               # Optional. Default: 30 seconds
  cooldownPeriod:  120                              # Optional. Default: 300 seconds
  minReplicaCount: 0                                # Optional. Default: 0
  maxReplicaCount: 10                               # Optional. Default: 100
  advanced:                                         # Optional. Section to specify advanced options
    restoreToOriginalReplicaCount: false            # Optional. Default: false
    horizontalPodAutoscalerConfig:                  # Optional. Section to specify HPA related options
      behavior:                                     # Optional. Use to modify HPA's scaling behavior
        scaleDown:
          stabilizationWindowSeconds: 300
          policies:
          - type: Percent
            value: 100
            periodSeconds: 15
  triggers:
  - type: redis
    metadata:
      address:  redis-keda-tuto-master.dev.svc.cluster.local:6379          # Format must be host:port
      listName: keda        # Required
      listLength: "10"      # Required
      enableTLS: "false"    # optional
      databaseIndex: "0"    # optional
    authenticationRef:
      name: keda-trigger-auth-redis-secret
Save the file.
See KEDA in action
Alright, congratulations on making it this far !
Now let's see KEDA in action. Run the kubectl apply command:
kubectl apply -f ./kedatutorial_scaledobject.yml
Run the kubectl get pods command to check then number of running pods:
$ kubectl get pods
kedatutorial-microservice-794d98b5-4flvg 1/1 Running 0 2m1s
There should initially be 1 replica ready, the scaling of the replica will start after the polling period is eclipsed.
Now, monitore the pods status with the command:
kubectl get pods -w
Some pods should be created and a final output looking like this:
NAME READY STATUS RESTARTS AGE
 kedatutorial-microservice-794d98b5-4flvg 1/1 Running 0 3m
 kedatutorial-microservice-794d98b5-4jpxp 1/1 Running 0 3m
 kedatutorial-microservice-794d98b5-4lw7b 1/1 Running 0 2m15s
 kedatutorial-microservice-794d98b5-5fqj5 1/1 Running 0 3m
 kedatutorial-microservice-794d98b5-5kdbw 1/1 Running 0 2m15s
 kedatutorial-microservice-794d98b5-64qsm 1/1 Running 0 3m
 kedatutorial-microservice-794d98b5-bmh7b 1/1 Running 0 3m8s
 kedatutorial-microservice-794d98b5-gkstw 1/1 Running 0 2m15s
 kedatutorial-microservice-794d98b5-pl7v7 1/1 Running 0 2m15s
 kedatutorial-microservice-794d98b5-rgmvx 1/1 Running 0 2m15s
And after all the items have been processed and the cooldownPeriod has expired, you will see that the number of pods is zero. Why zero? The reason that KEDA removes all running replicas is that there are no items left to process, within our ScaledObject manifest we set minReplicaCount: 0 and restoreToOriginalReplicaCount: false.
If you wants to test further on your own, you can still open another window and go back to the step Install Redis to populate the list and trigger KEDA again.
Summary
The video editing company face different peaks in usage of its application during the day. Scaling dynamically will help them save resources while providing the best experience to their end-users. However, as CPU and memory-based metrics are not representative, HPA cannot be directly used to that end. The final product needed to be event-driven so that the scaling can be done accordingly to the number of messages in the queue.
This example illustrates perfectly the strength of KEDA. We saw that it can be used to effectively sale up and down the application instances by directly looking at messages to be processed in Redis.
This example can be easily reused and adapted to any other architectures with a queue. For example, the list of messages may be coming from an Apache Kafka topic, and you'll just have to use the built-in KED Apache Kafka scaler instead.
This use case is inspired from an official Azure AKS tutorial. For more details, you can follow the original tutorial here
Clean up
Here are the commands to delete all resources deployed during this exercice:
kubectl delete -f ./kedatutorial_scaledobject.yml
kubectl delete -f ./kedatutorial_microservice.yml
kubectl delete pod redis-client
helm uninstall redis-keda-tuto
Use case 2: Finance Company
A Finance company have an application that computes transactionnal data. Due to the computation time implied by the process, the application can only handle a certain amount of processes at the same time. The company wish to be able to scale the number of application instances according to the number of requests received.
KEDA is the perfect tool for this scenario, as we wish to use metrics information to scale the application instances.
In this module, we'll deploy KEDA into an AKS environment and deploy a scaler object to autoscale containers based on the number of requests received by the application :
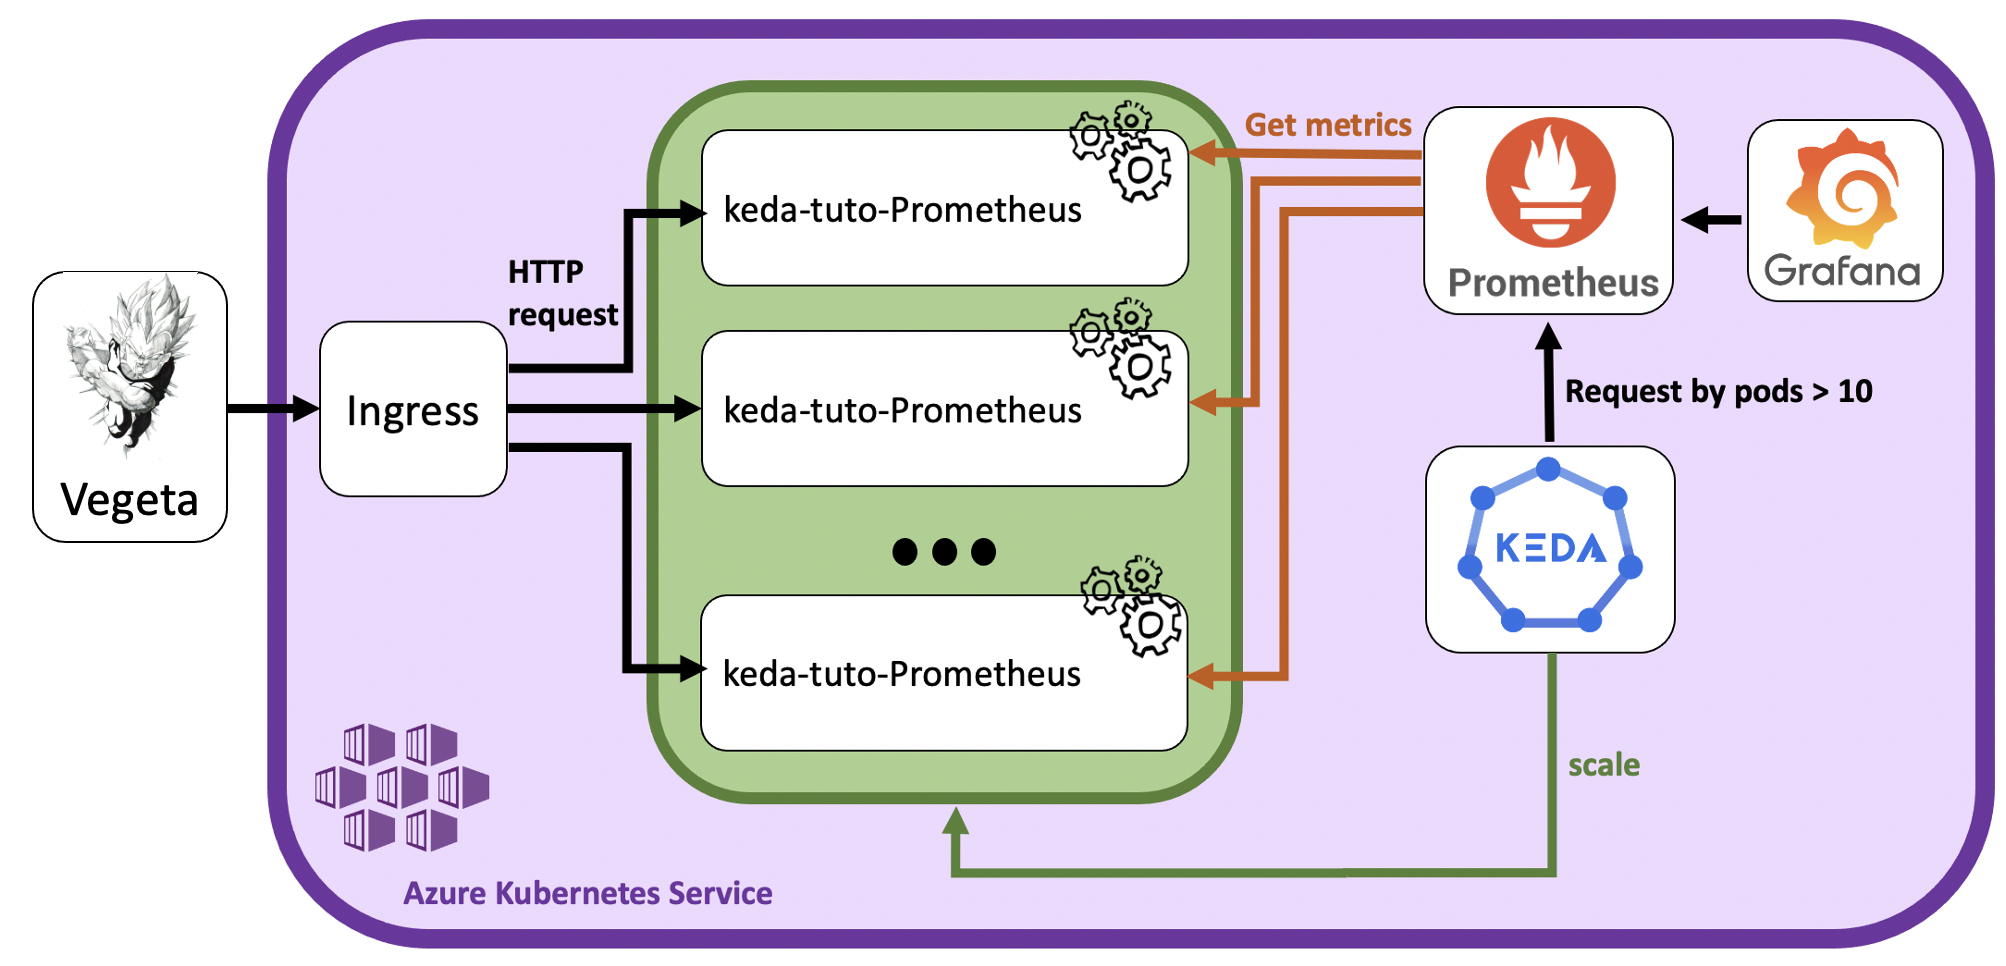
- Vegeta: HTTP load testing tool used to send requests;
- Ingress: Kubernetes object that exposes the application outside of the cluster;
- keda-tuto-prometheus: The application pods;
- Prometheus: Monitoring solution that collects the number of requests received;
- Grafana: Metrics visualization tool;
- KEDA: KEDA automatically scales the pods according to the number of requests.
The scenario will include the following steps:
- Install KEDA: Set up KEDA in your cluster;
- Deploy the application: Deploy the application and expose it;
- Collect the metrics: Collect metrics with Prometheus and visualise them in Grafana;
- Install Vegeta: Install the HTTP load testing tool Vegeta and try it on the app;
- Scale with KEDA according to the requests rate: Set the KEDA trigger to listen on the Prometheus metrics;
- See KEDA in action: Play with Vegeta and observe the pods status;
- Summary: Conclusion on the use if KEDA in this context;
- Clean up: Clean up by deleting the deployed resources.
Install KEDA
Ask the K8saas team to deploy KEDA to your cluster.
Once installed, it's running, but not used, as no triggers has been defined yet.
Deploy the application
The example application used in this use case is a simple Python API that increments an internal counter every time a request is received.
It has two endpoints:
- / : send the json
{"STATUS":"OK"} - /metrics : send metrics formated for Prometheus, including request_count_total, the metr`c used to count the number of requests processed by the app.
For more details about the application, the source code is available on Gitlab
Here, we'll deploy the application by fetching the image directly from Artifactory.
Using your Artifactory email and API key, create a secret with the following command:
kubectl create secret docker-registry regcred-af \
  --namespace dev \
  --docker-server=artifactory.thalesdigital.io \
  --docker-username=<ARTIFACTORY_EMAIL> \
  --docker-password=<ARTIFACTORY_API_KEY>
Then create a file kedatuto-prometheus-deploy.yaml with the following content:
apiVersion: apps/v1
kind: Deployment
metadata:
  name: keda-tuto-prometheus
  namespace: dev
spec:
  replicas: 1
  selector:
    matchLabels:
      app: keda-tuto-prometheus
  template:
    metadata:
      labels:
        app: keda-tuto-prometheus
    spec:
      containers:
      - name: keda-tuto-prometheus
        image: artifactory.thalesdigital.io/docker/k8saas/keda-prometheus-app:TC2-855-KEDA-tutorial-latest
        imagePullPolicy: Always
        ports:
        - name: api
          containerPort: 8000
      imagePullSecrets:
        - name: regcred-af
---
apiVersion: v1
kind: Service
metadata:
  name: keda-tuto-prometheus
  namespace: dev
  labels:
    app: keda-tuto-prometheus
spec:
  type: ClusterIP
  selector:
    app: keda-tuto-prometheus
  ports:
  - name: api
    port: 8000
---
apiVersion: networking.k8s.io/v1
kind: Ingress
metadata:
  name: keda-tuto-prometheus
  annotations:
    cert-manager.io/cluster-issuer: letsencrypt-staging
spec:
  ingressClassName: nginx
  tls:
  - hosts:
    - keda-tuto-prometheus.<CLUSTER-NAME>.kaas.thalesdigital.io
    secretName: tls-secret
  rules:
  - host: keda-tuto-prometheus.<CLUSTER-NAME>.kaas.thalesdigital.io
    http:
      paths:
      - path: /
        pathType: Prefix
        backend:
          service:
            name: keda-tuto-prometheus
            port:
              number: 8000
Change <CLUSTER_NAME> by the name of your cluster in order to make your application url unique.
It will create:
- a deployment "keda-tuto-prometheus": that will create and monitor one pod instance by default;
- a service "keda-tuto-prometheus": that will expose the application pods inside the cluster;
- an Ingress "keda-tuto-prometheus": that will expose the service outside the cluster.
Deploy the resources:
$ kubectl apply -f kedatuto-prometheus-deploy.yaml
deployment.apps/keda-tuto-prometheus created
service/keda-tuto-prometheus created
ingress.networking.k8s.io/keda-tuto-prometheus created
Check if the resources are available:
$ kubectl get deployment
NAME                              READY   UP-TO-DATE   AVAILABLE   AGE
keda-tuto-prometheus              1/1     1            1           2m

$ kubectl get pods
NAME                                               READY   STATUS    RESTARTS   AGE
keda-tuto-prometheus-7c7bc74fcd-4h2w6              1/1     Running   0          2m45s
And try to access the application from outside:
$ curl -Lk keda-tuto-prometheus.<CLUSTER-NAME>.kaas.thalesdigital.io
{"STATUS":"OK"}

$ curl -Lk keda-tuto-prometheus.<CLUSTER-NAME>.kaas.thalesdigital.io/metrics
# HELP python_gc_objects_collected_total Objects collected during gc
# TYPE python_gc_objects_collected_total counter
python_gc_objects_collected_total{generation="0"} 43658.0
...
Perfect ! Now that our application is up and running, let's collect the metrics in Prometheus.
Collect the metrics
Prometheus is a monitoring solution that works on a pull basis. It means that it's going to come collect the data by requesting the /metrics endpoint of the API.
We'll use the Prometheus instance already installed and running on your kubernetes cluster. However, we still need to flag our application by deploying a ServiceMonitor, in order to tell Prometheus to come and collect its metrics.
Create a file kedatuto-prometheus-servicemonitor.yaml with the following content:
apiVersion: monitoring.coreos.com/v1
kind: ServiceMonitor
metadata:
  name: keda-tuto-prometheus
  namespace: dev
  labels:
    app: keda-tuto-prometheus
spec:
  selector:
    matchLabels:
      app: keda-tuto-prometheus
  endpoints:
  - port: api
And deploy it in the cluster:
$ kubectl apply -f kedatuto-prometheus-servicemonitor.yaml
servicemonitor.monitoring.coreos.com/keda-tuto-prometheus created
Now, let's check if the metrics are being collected by Prometheus using Grafana. Grafana is an analytics and visualization web application. Your cluster's Grafana instance is accessible using the url:
https://grafana.<CLUSTER_NAME>.<region>.k8saas.thalesdigital.io/
To test our application, we'll use the explore function:
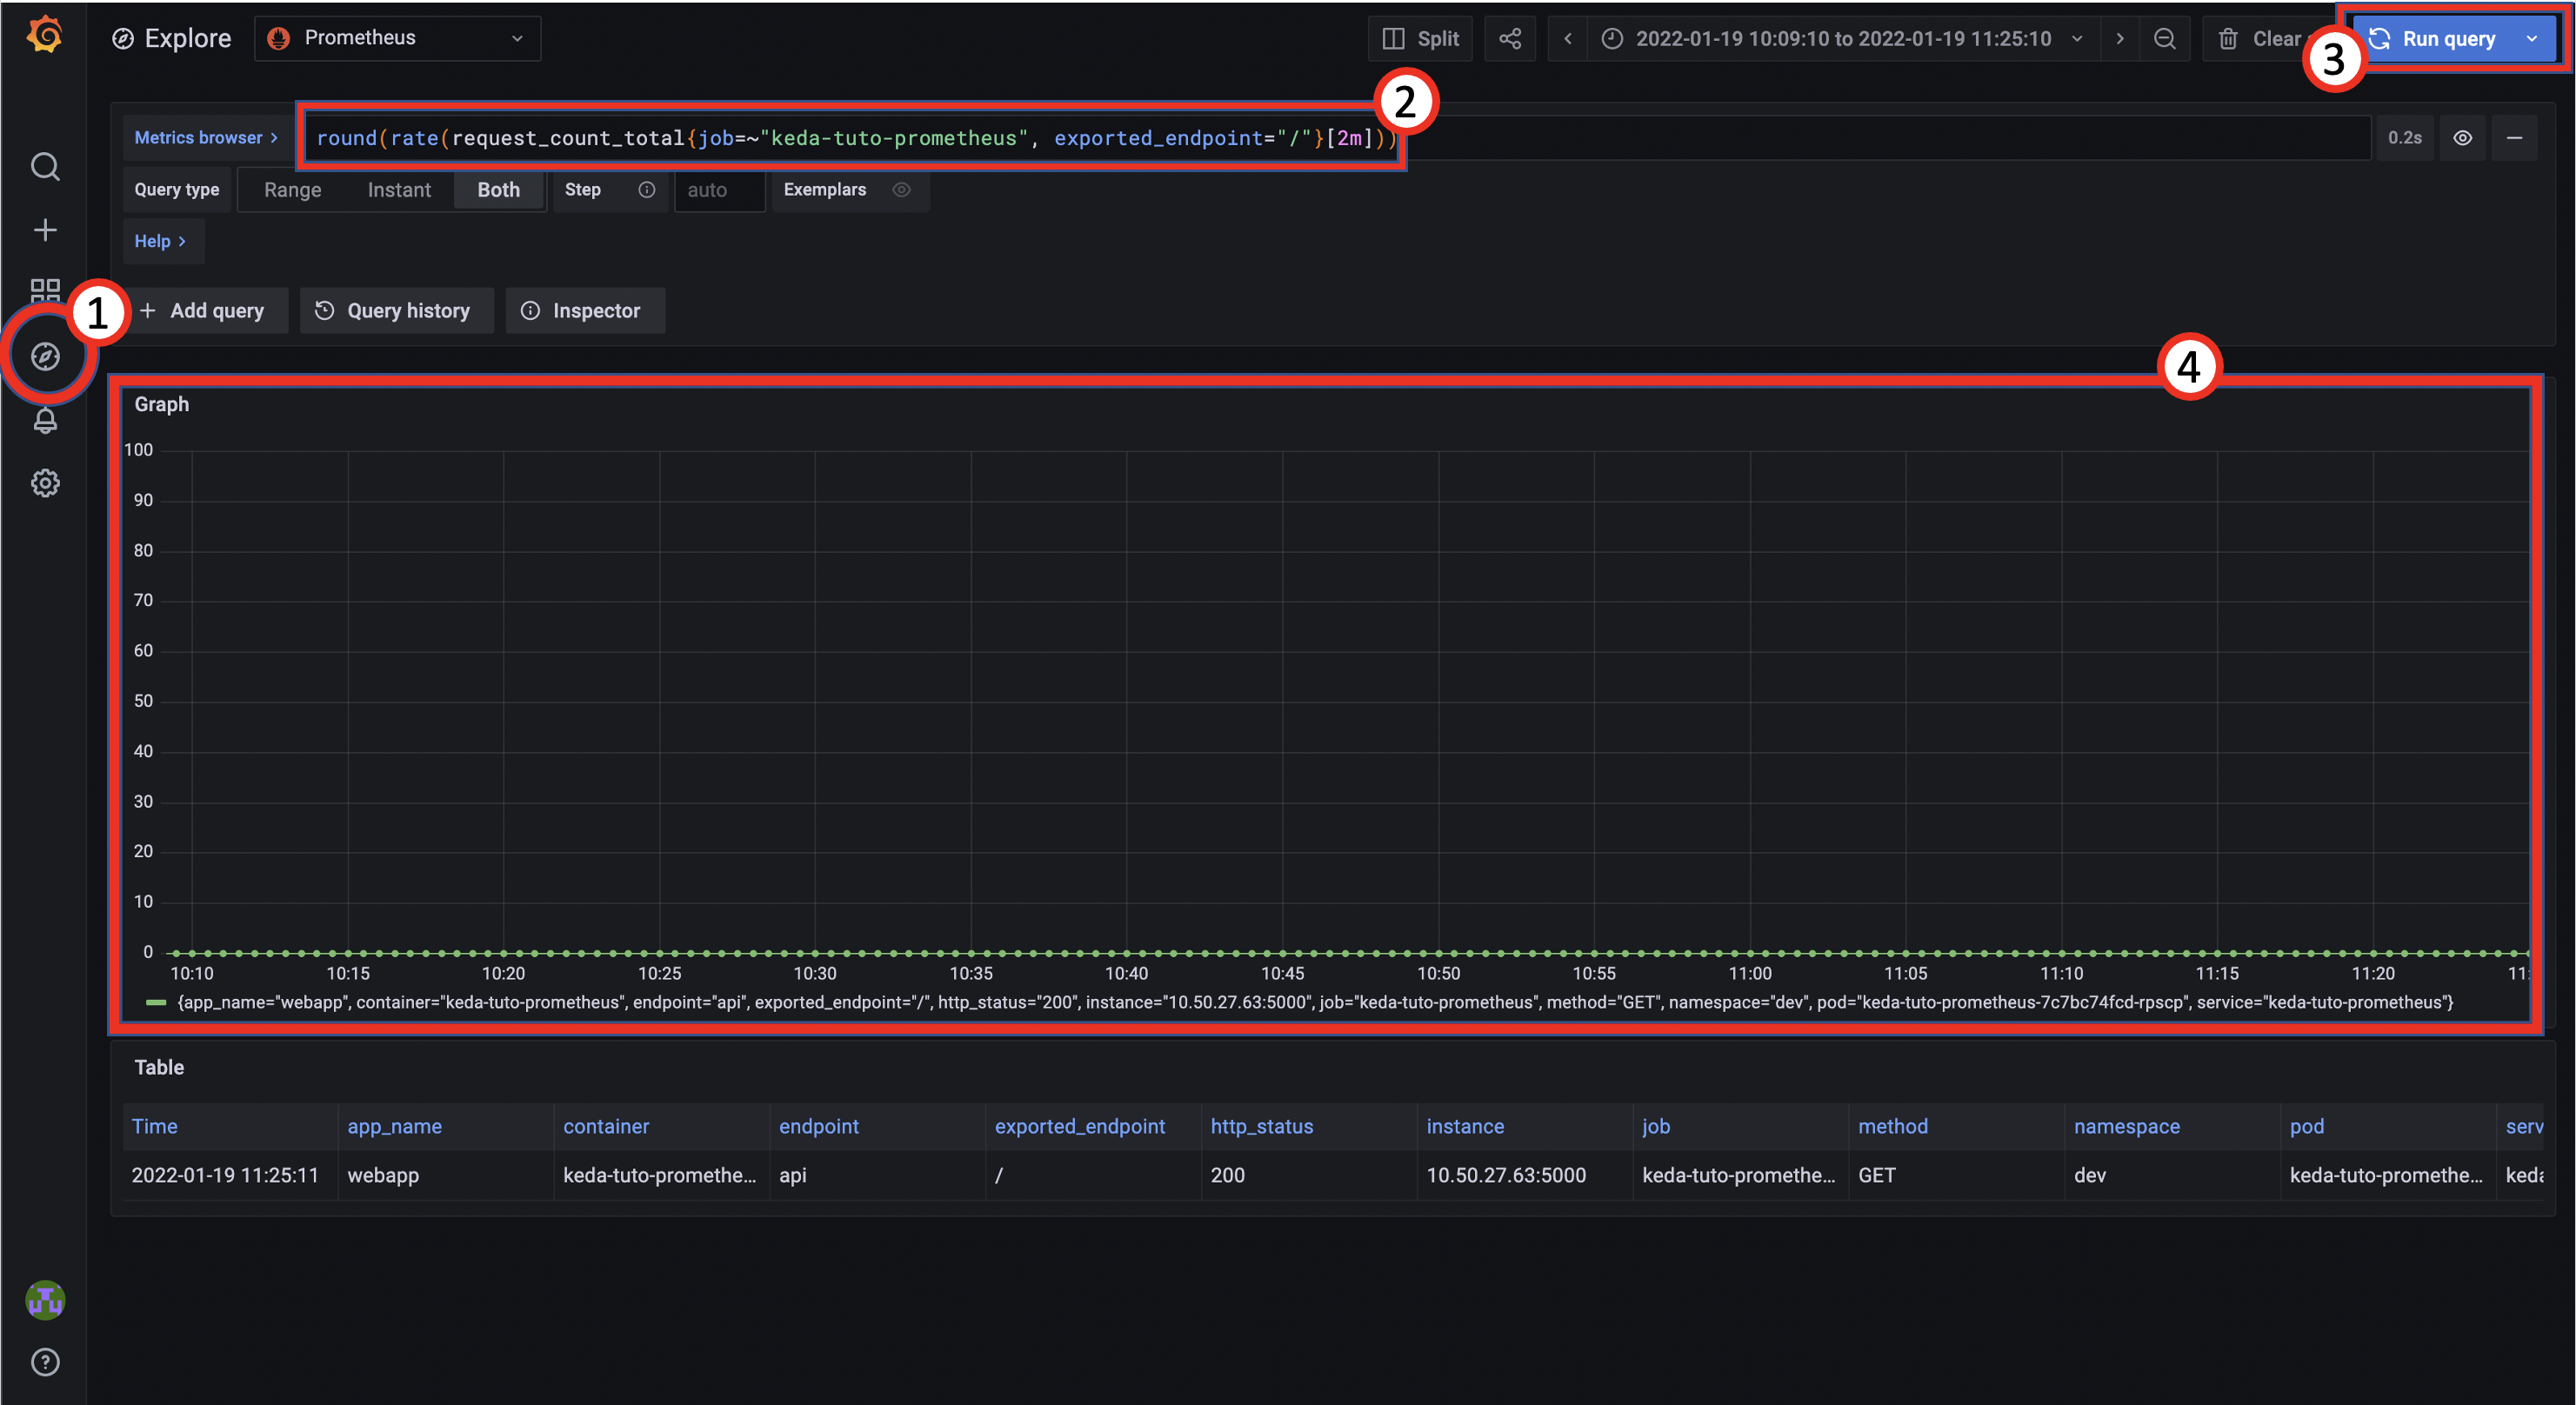
- (1) Click on the Explore tab;
- (2) Enter the request:
*round(rate(request_count_total{job=~"keda-tuto-prometheus"}[2m]))*; - (3) Click on the "Run query" button on the top-right corner;
- (4) See the result graph.
The request we are using is in the language PromQL, the prometheus language. This one is structured to request the metric "request_count_total" from our application, designated by the job=~"keda-tuto-prometheus". Then we want the metric rate over a window of 2 seconds.
To better see KEDA in action, we'll use a specific dashboard.
This dashboard will be automatically imported to Grafana by using a configmap.
Create a file keda_prometheus_dashboard.yaml using this template..
And apply it:
$ kubectl apply -f keda_prometheus_dashboard.yaml
configmap/kedatuto-prometheus-dashboard created
Now, check if the dasboard has been successfully deployed in Grafana with the following steps:
- Put your mouse on to the "Dashboard" tab (Third one from top), and select "Manage";
- Click on the folder "K8saas";
- Cick on "Keda Prometheus Tutorial";
By default, it looks like the screenshot below:
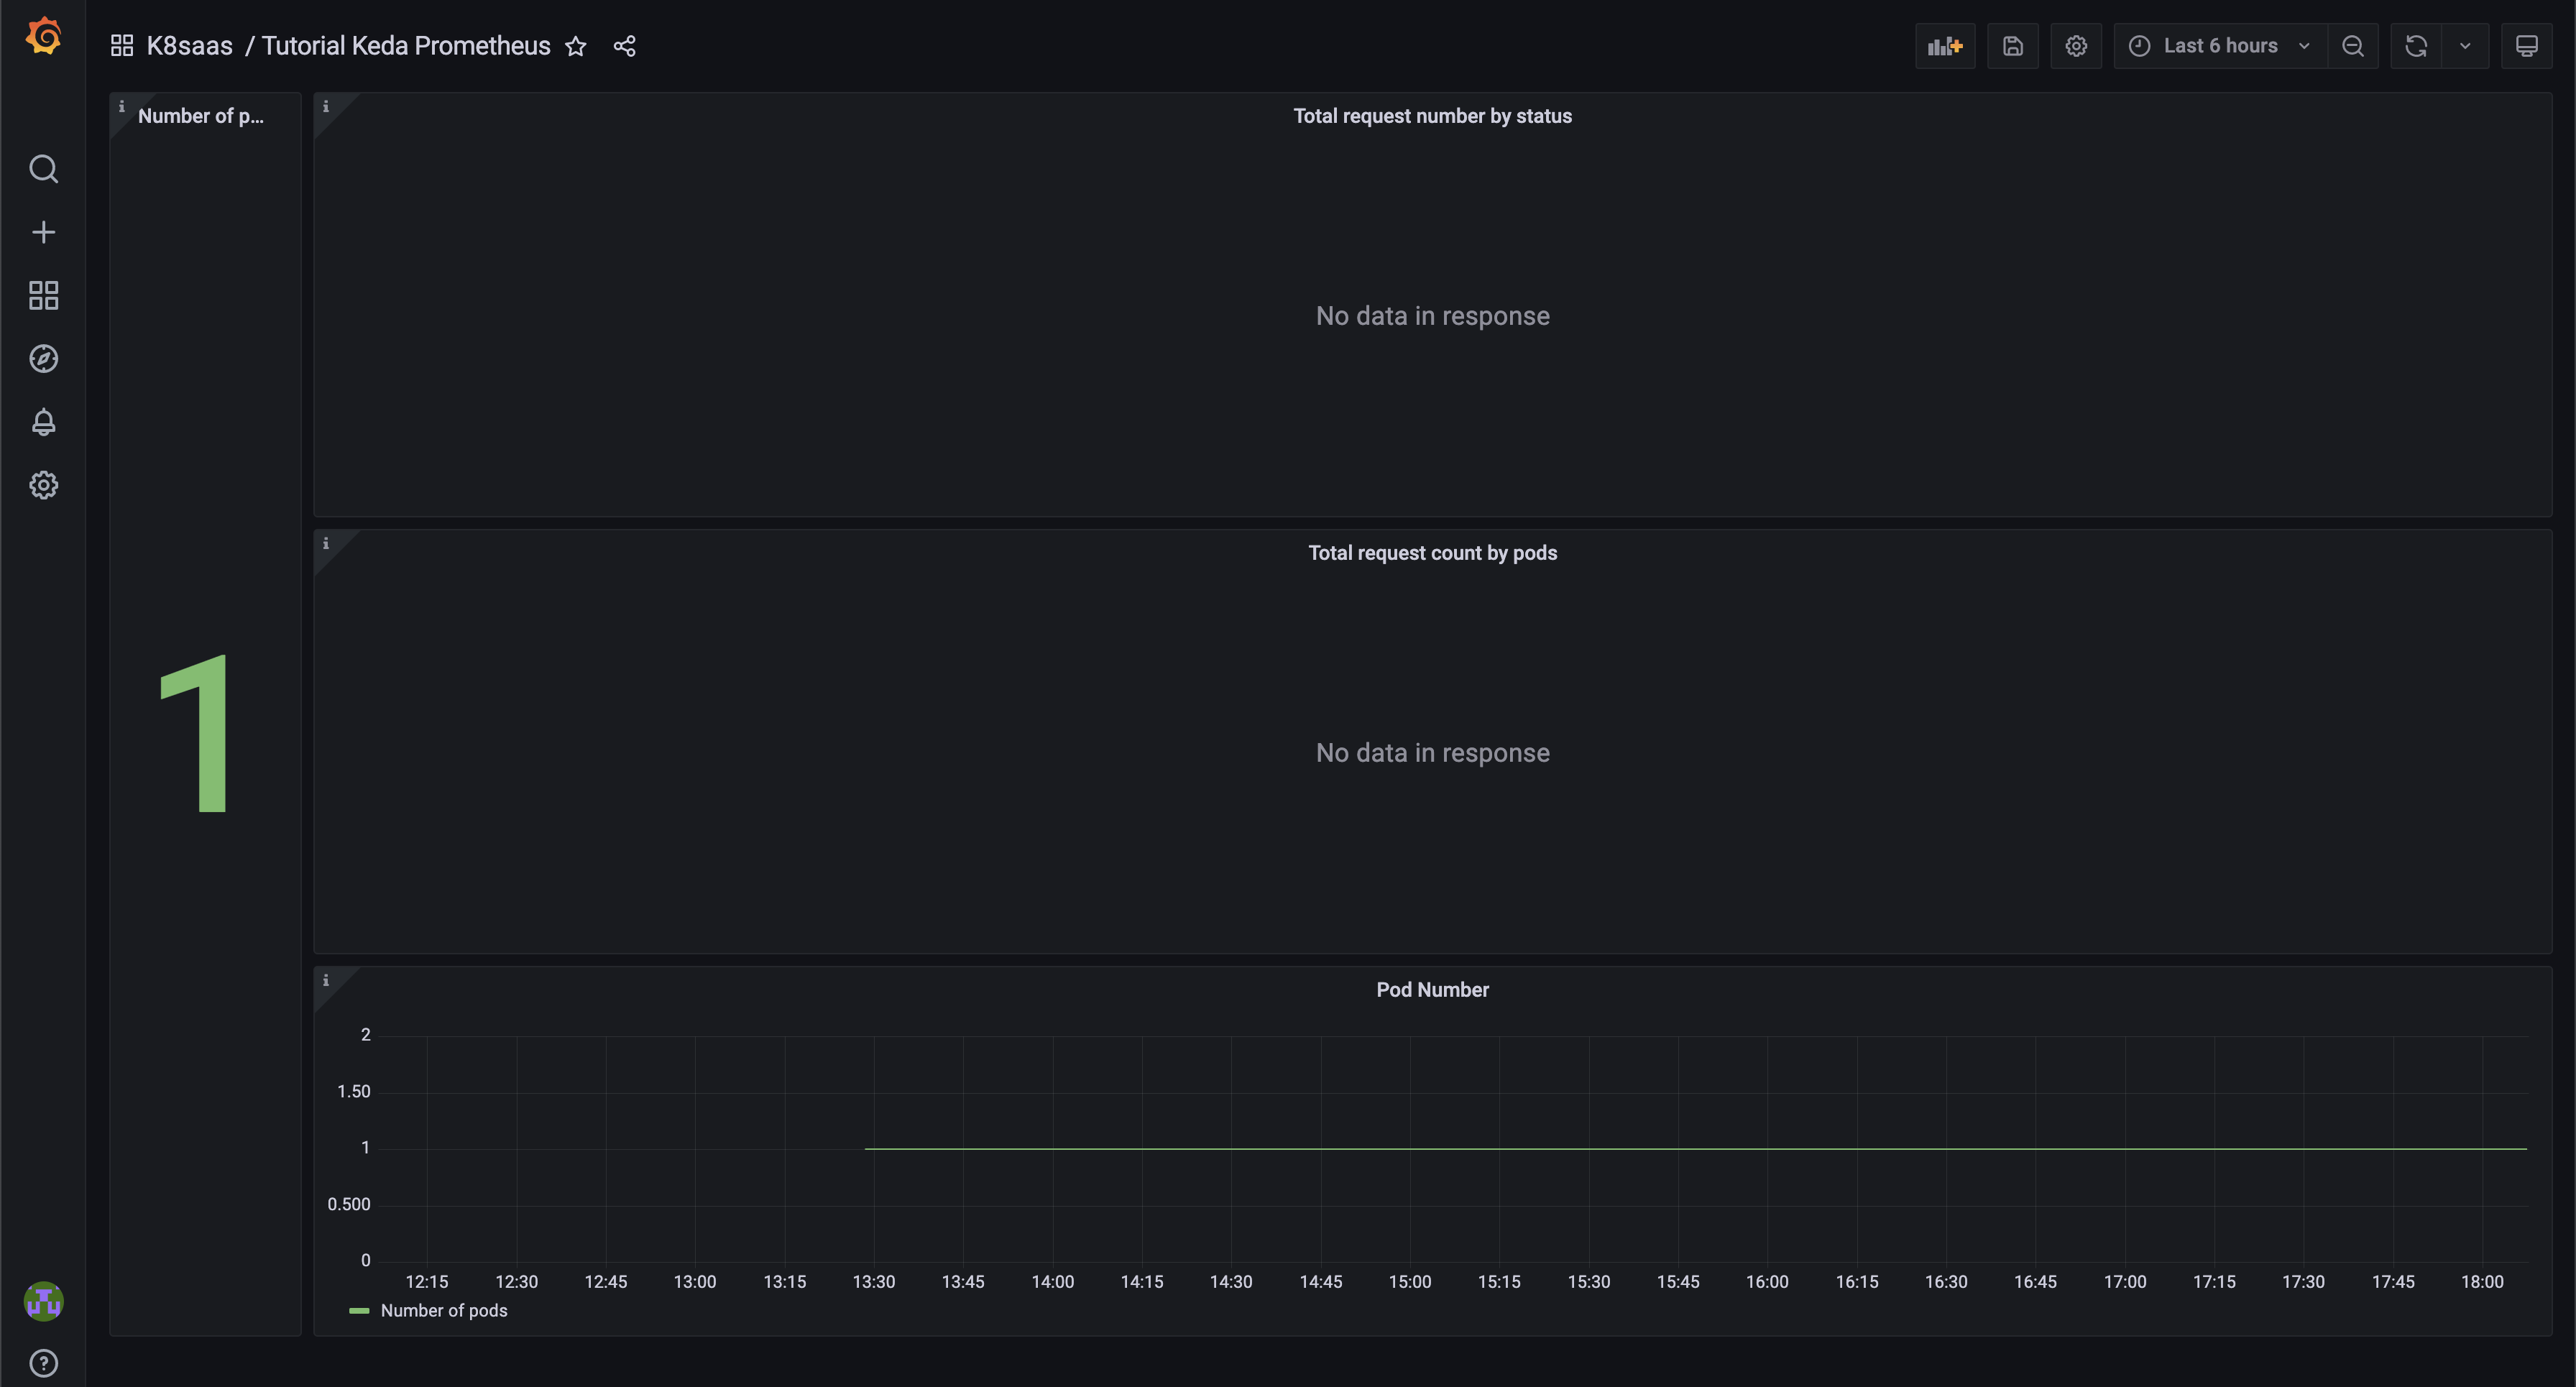
The dashboard will be use and explained in the section See KEDA in Action.
Install Vegeta
Now is the time to stress out the application by sending HTTP requests to it.
To this end, we'll use the tool Vegeta. Vegeta is a versatile HTTP load testing tool written in go.
To install it on your computer, use the following command:
brew update && brew install go vegeta
Test by sending some requests to the application. This command will send 30 requests by second for 30 seconds straight, and print a report:
$ echo "GET https://keda-tuto-prometheus.<CLUSTER_NAME>.kaas.thalesdigital.io/" | vegeta attack -duration=30s -rate=30 -insecure | vegeta report --type=text
Requests      [total, rate, throughput]         900, 30.03, 29.99
Duration      [total, attack, wait]             30.01s, 29.968s, 42.653ms
Latencies     [min, mean, 50, 90, 95, 99, max]  30.888ms, 87.991ms, 42.498ms, 90.137ms, 232.045ms, 1.237s, 1.49s
Bytes In      [total, mean]                     14400, 16.00
Bytes Out     [total, mean]                     0, 0.00
Success       [ratio]                           100.00%
Status Codes  [code:count]                      200:900
Error Set:
Scale with KEDA according to the requests rate
We already seen the different part of a scaledObject in the previous use case.
Here the only difference is the trigger with the Prometheus scaler:
  triggers:
  - type: prometheus
    metadata:
      serverAddress: http://prometheus-operator-kube-p-prometheus.monitoring.svc.cluster.local:9090
      metricName: request_count_total
      query: rate(request_count_total{job=~"keda-tuto-prometheus", exported_endpoint="/"}[2m])
      threshold: '10'
The trigger is composed of:
- type: prometheus;
- serverAddress: the prometheus server address;
- metricName: name to identify the metric;
- query: the PromQl request as explained earlier;
- treshold: triggers KEDA if the query result exceed the treshold.
Keda is set to use the query on Prometheus and watch that the value does not exceed 10. Otherwise it will scale up the application pods to match demands.
Create the final file "kedatuto-prometheus-scaledobject.yaml":
apiVersion: keda.sh/v1alpha1
kind: ScaledObject
metadata:
  name: scaled-keda-tuto-prometheus
spec:
  scaleTargetRef:
    apiVersion: apps/v1                             # Optional. Default: apps/v1
    kind: deployment                                # Optional. Default: Deployment
    name: keda-tuto-prometheus                      # Mandatory. Must be in the same namespace as the ScaledObject
  pollingInterval: 30                               # Optional. Default: 30 seconds
  cooldownPeriod:  120                              # Optional. Default: 300 seconds
  minReplicaCount: 1                                # Optional. Default: 0
  maxReplicaCount: 10                               # Optional. Default: 100
  advanced:                                         # Optional. Section to specify advanced options
    restoreToOriginalReplicaCount: false            # Optional. Default: false
    horizontalPodAutoscalerConfig:                  # Optional. Section to specify HPA related options
      behavior:                                     # Optional. Use to modify HPA's scaling behavior
        scaleDown:
          stabilizationWindowSeconds: 300
          policies:
          - type: Percent
            value: 100
            periodSeconds: 15
  triggers:
  - type: prometheus
    metadata:
      # Required fields:
      serverAddress: http://prometheus-operator-kube-p-prometheus.monitoring.svc.cluster.local:9090
      metricName: request_count_total # Note: name to identify the metric, generated value would be `prometheus-http_requests_total`
      query: sum(rate(request_count_total{job=~"keda-tuto-prometheus"}[2m])) # Note: query must return a vector/scalar single element response
      threshold: '10'
And deploy it using:
$ kubectl apply -f kedatuto-prometheus-scaledobject.yaml
scaledobject.keda.sh/scaled-keda-tuto-prometheus created
Check the ScaledObject status:
$ kubectl get scaledobject
NAME                          SCALETARGETKIND      SCALETARGETNAME        MIN   MAX   TRIGGERS     AUTHENTICATION                   READY   ACTIVE    AGE
scaled-keda-tuto-prometheus   apps/v1.deployment   keda-tuto-prometheus   1     20    prometheus                                    True    False     3m
Alright ! KEDA is configured and ready to be used !
See KEDA in Action
To see KEDA in action, we'll send requests with Vegeta that will increase the request_count_total metric in Prometheus and triggers the KEDA scaling process.
To better understand and visualize the process, open a terminal to execute Vegeta and a browser with the Grafana Dashboard side to side.
And we'll watch carefully the 4 different parts of the Grafana Dashboard:
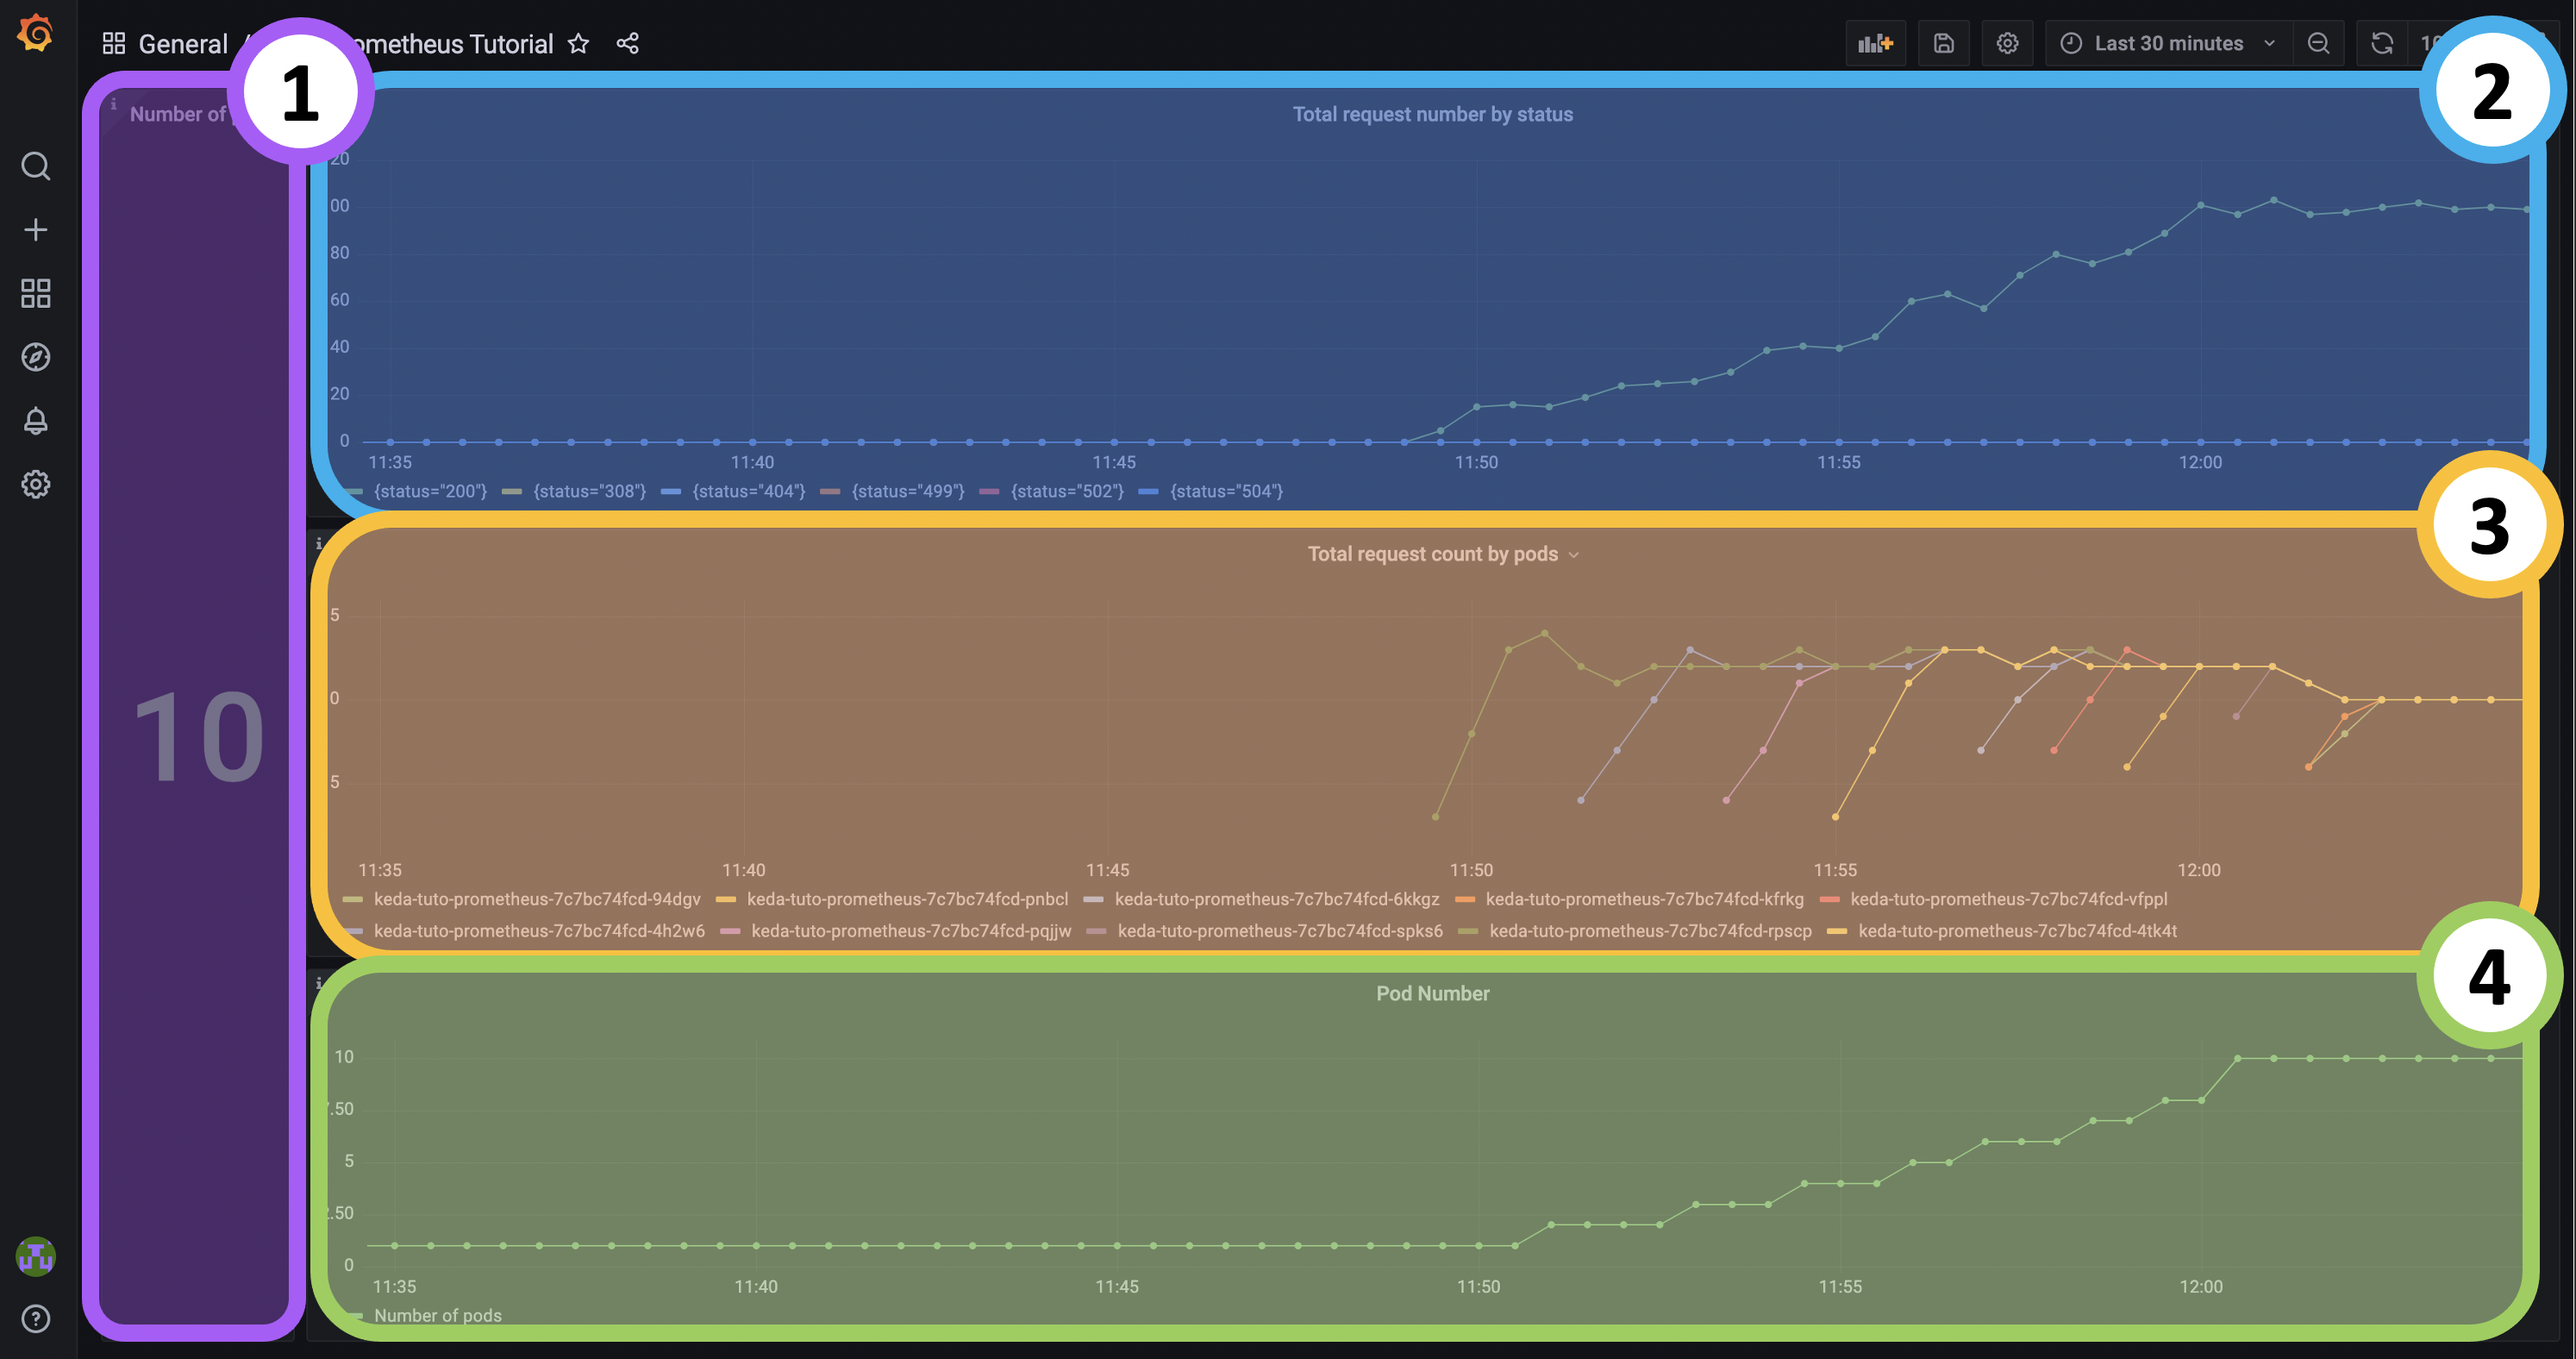
- (1) The live number of pods keda-tuto-prometheus-* : Quick view of the actual number of pods that have been scaled with KEDA;
- (2) The Nginx rate of requests to the application: Real-time evolution of the rate of the total number of requests coming to our application address;
- (3) The rate of requests received by pods: Real-time evolution of the rate of requests received by each running pod;
- (4) The number of pods keda-tuto-prometheus-* over time: Real-time evolution of the number of pods being scaled by KEDA.
Let's start by sending more and more requests progressively and study KEDA behaviour. Create a file named "vegeta_increasing_requests.sh":
#!/bin/bash

set -euo pipefail

for rate in 15 25 40 60 80 100 100 100; do
  echo "Rate: "$rate
  echo "GET https://keda-tuto-prometheus.<CLUSTER_NAME_without_k8saas>.kaas.thalesdigital.io/metrics" | vegeta attack -duration=120s -rate="$rate" -insecure | vegeta report --type=text
done
Be sure to change <CLUSTER_NAME> by the name of your cluster.
This simple loop will just tell Vegeta to send waves of requests every seconds for 16 minutes straight. The number of request will increase every 2 minute till it stays at 100 requests per seconds for the last 6 minutes.
Execute the script:
chmod +x vegeta_increasing_requests.sh
./vegeta_increasing_requests.sh
After 15 minutes here what the dashboard looks like:
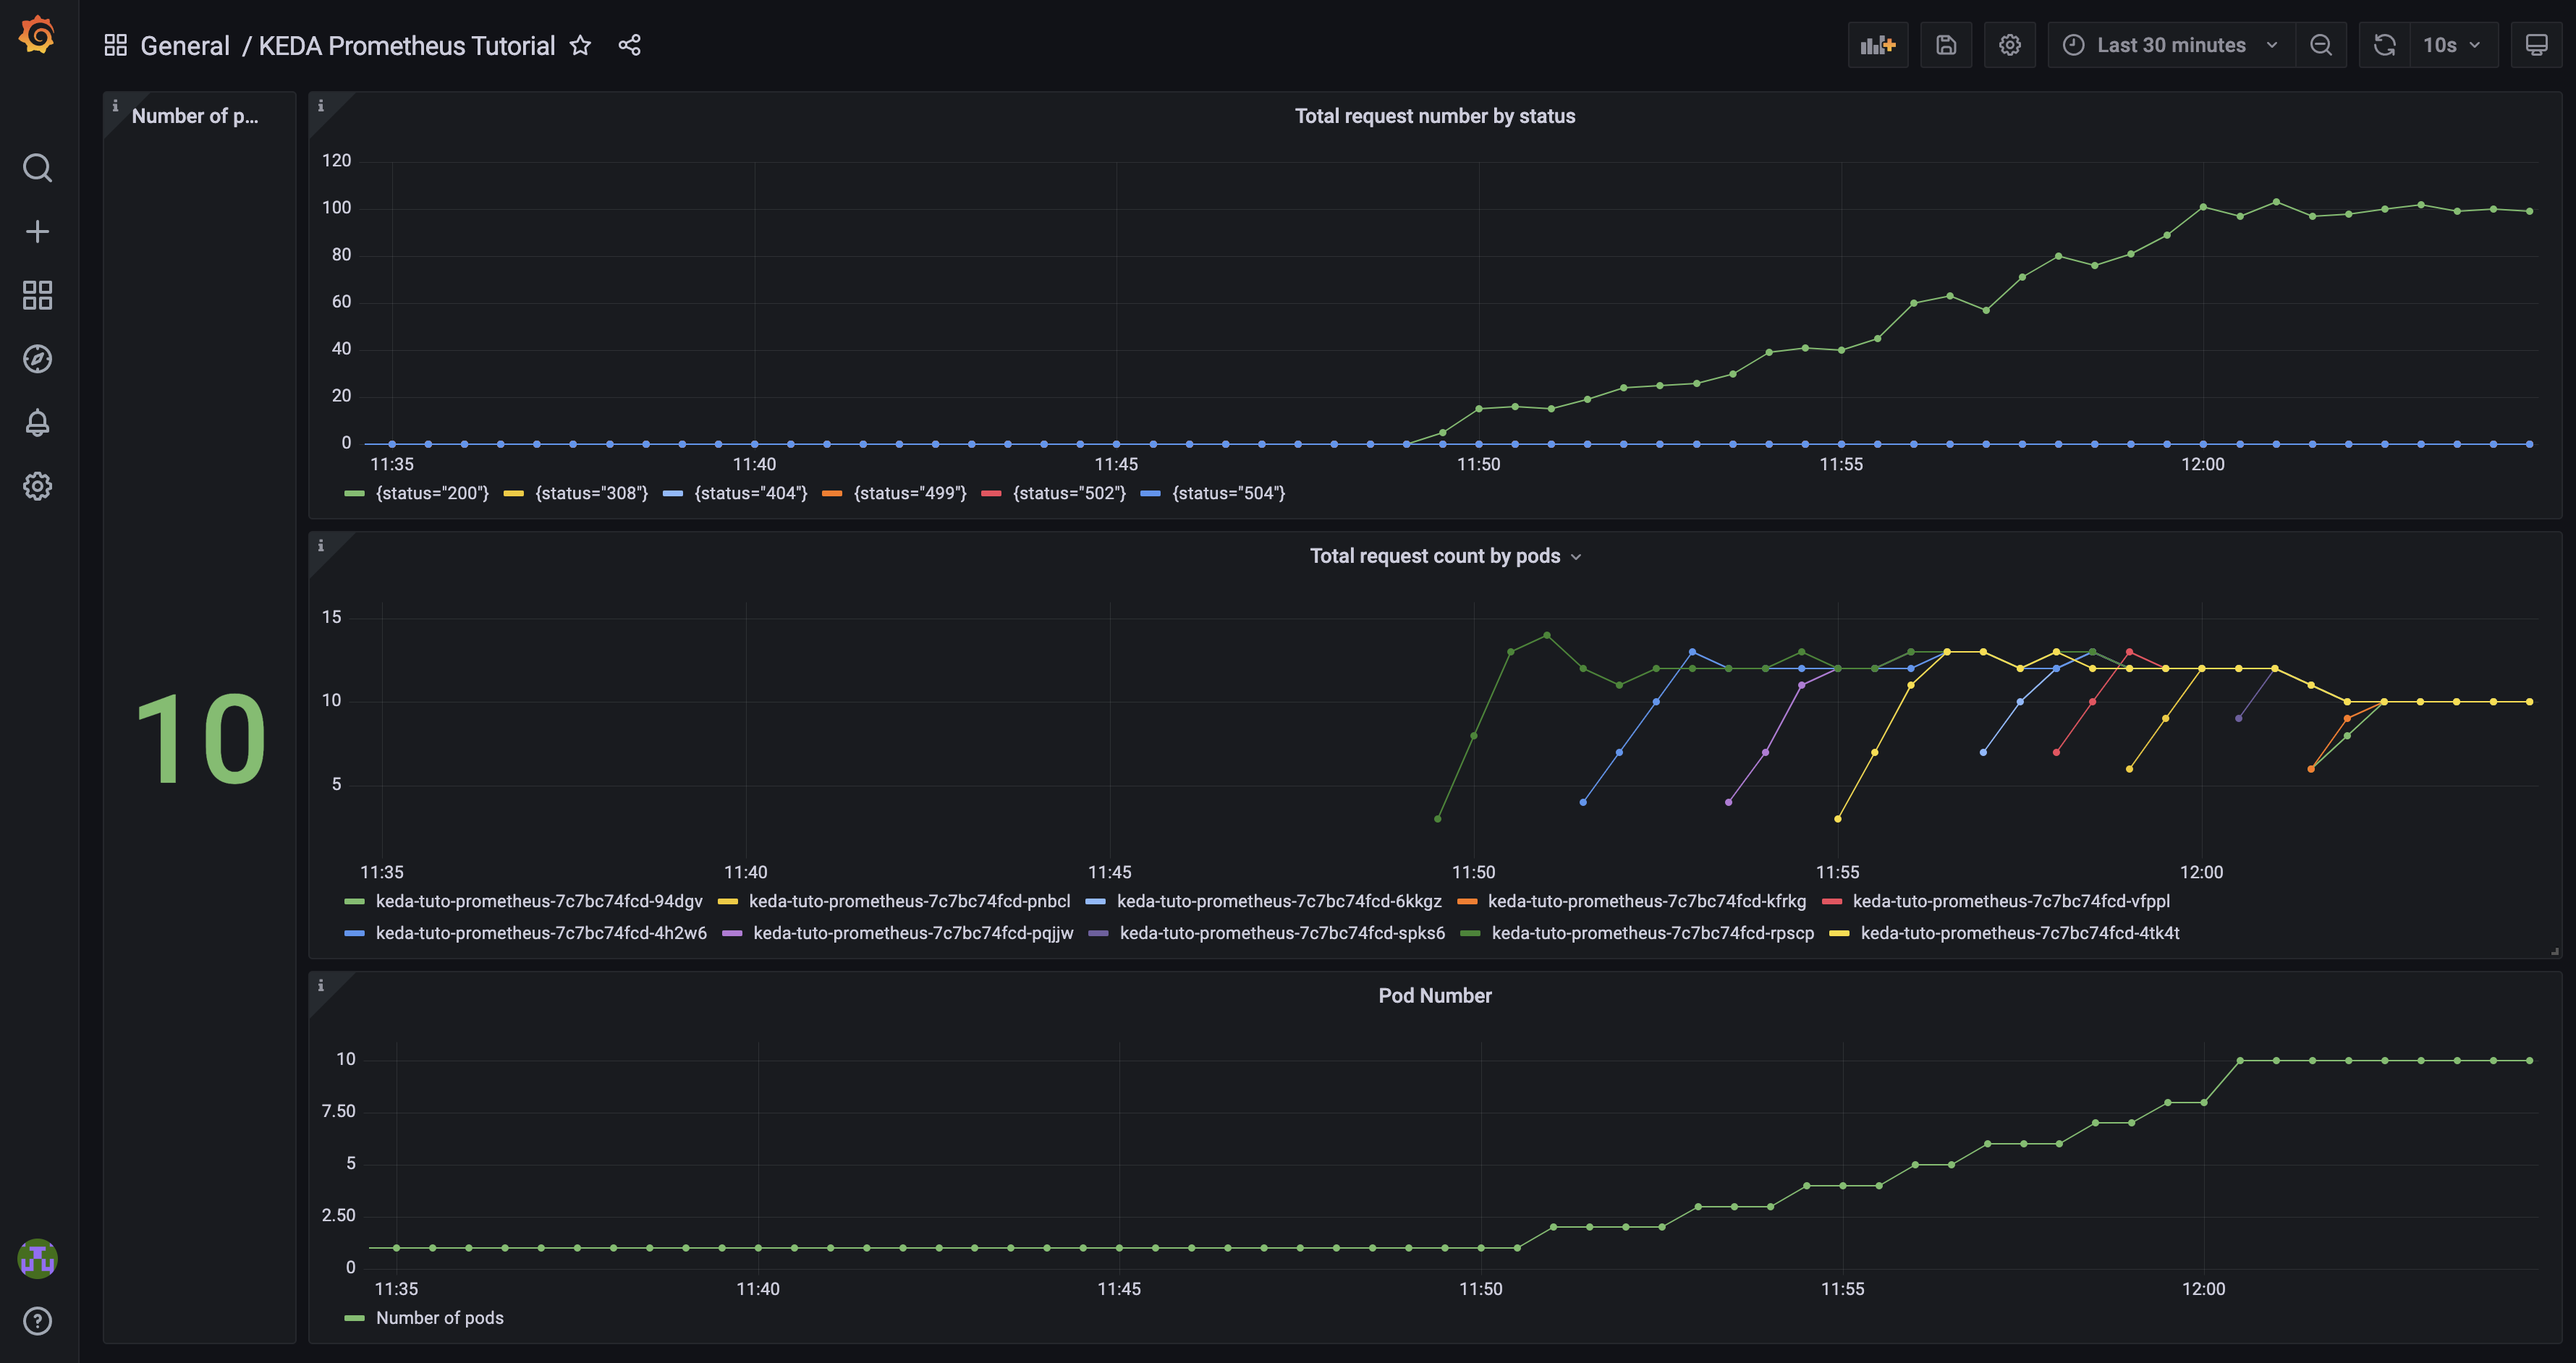
We'll zoom in to better look at what is happening:
 The total number of requests to the application address increases over time.
 As such, the number of requests per seconds per pods increases proportionnaly to the total number of requests.
However, every time the treshold of 10 requests per seconds is reached, KEDA scale up a new pod instance to distribute the load, and the individual rate of requests goes down.
 We can see that a new pods are created every time the rate of requests per pods goes over the limit of 10 requests/s.
By curiosity, if you check directly on your cluster, you'll see the pods running and their respective created dates:
$ kubectl get pods --namespace dev
NAME                                               READY   STATUS    RESTARTS   AGE
keda-tuto-prometheus-7c7bc74fcd-4h2w6              1/1     Running   0          16m
keda-tuto-prometheus-7c7bc74fcd-4tk4t              1/1     Running   0          12m
keda-tuto-prometheus-7c7bc74fcd-6kkgz              1/1     Running   0          10m
keda-tuto-prometheus-7c7bc74fcd-94dgv              1/1     Running   0          6m27s
keda-tuto-prometheus-7c7bc74fcd-kfrkg              1/1     Running   0          6m27s
keda-tuto-prometheus-7c7bc74fcd-pnbcl              1/1     Running   0          8m44s
keda-tuto-prometheus-7c7bc74fcd-pqjjw              1/1     Running   0          13m
keda-tuto-prometheus-7c7bc74fcd-rpscp              1/1     Running   0          1h
keda-tuto-prometheus-7c7bc74fcd-spks6              1/1     Running   0          7m44s
keda-tuto-prometheus-7c7bc74fcd-vfppl              1/1     Running   0          9m46s
Then, once the script is over or stopped. No more requests are being sent to the application but the number of pods stays up to 10 until the KEDA timeout expire.
In our case the timeout has been set with cooldownPeriod: 120.
So if we wait for a cpuple minutes more for the time window to stabilize, about 5 min after stopping the incoming requests we can see KEDA restoring the numbers of pods to 1:
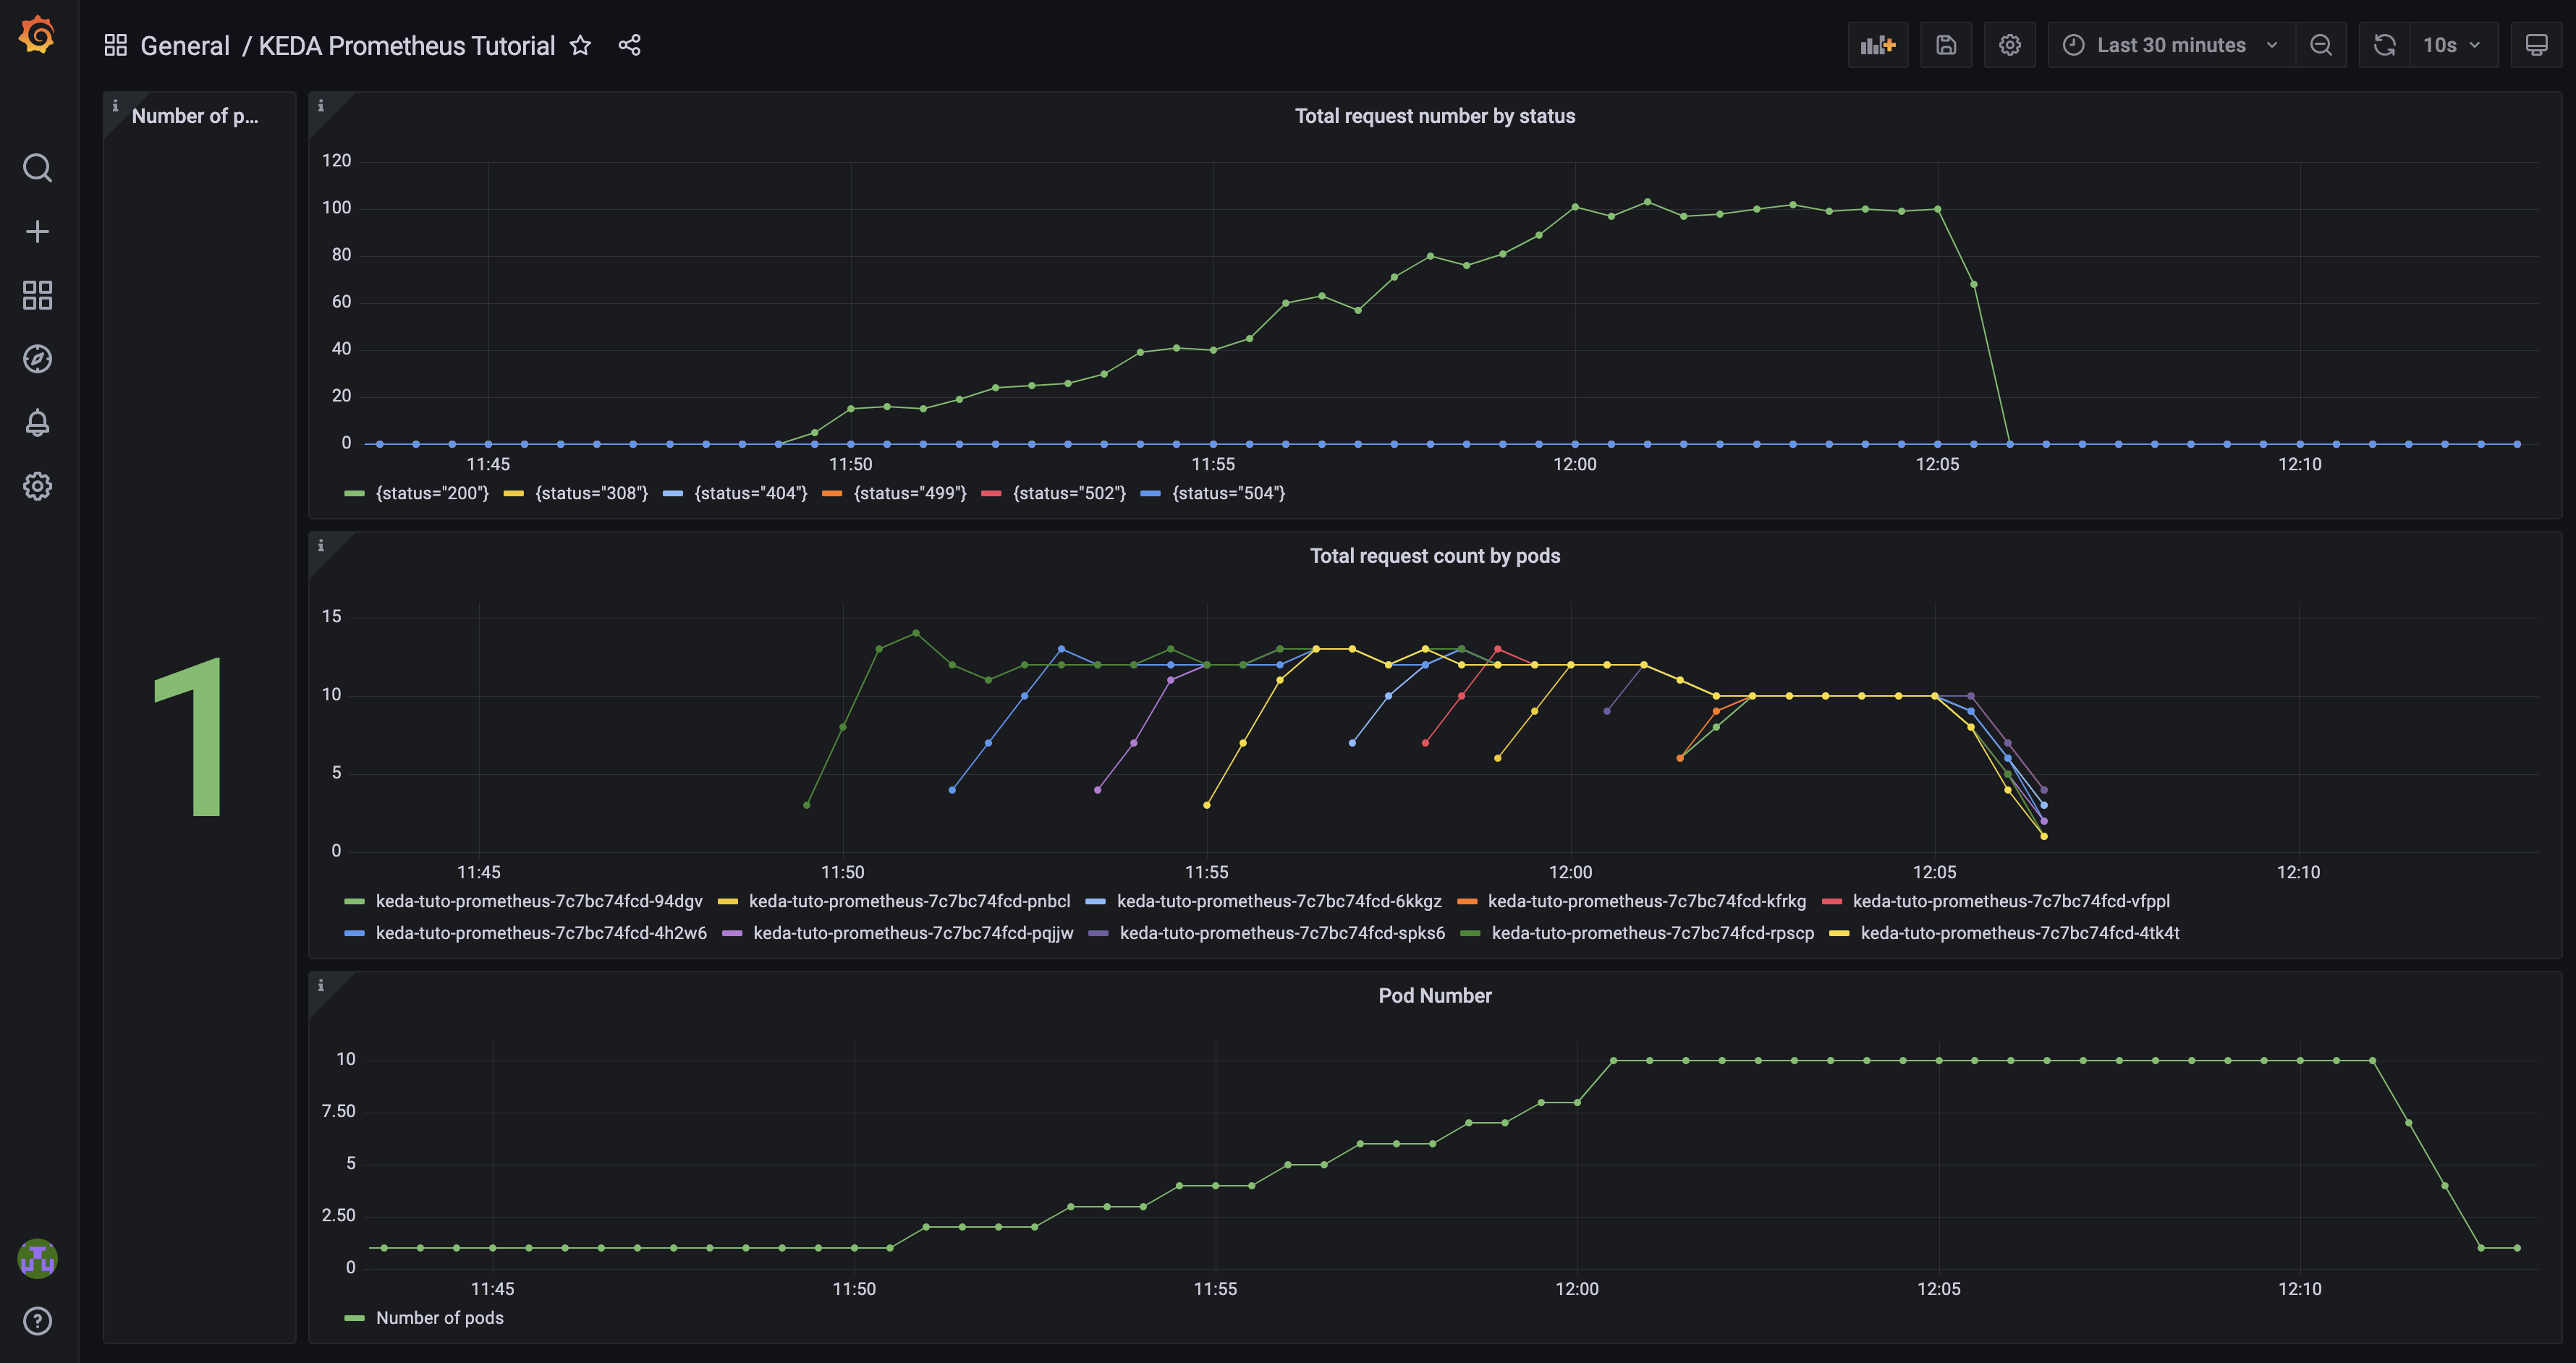
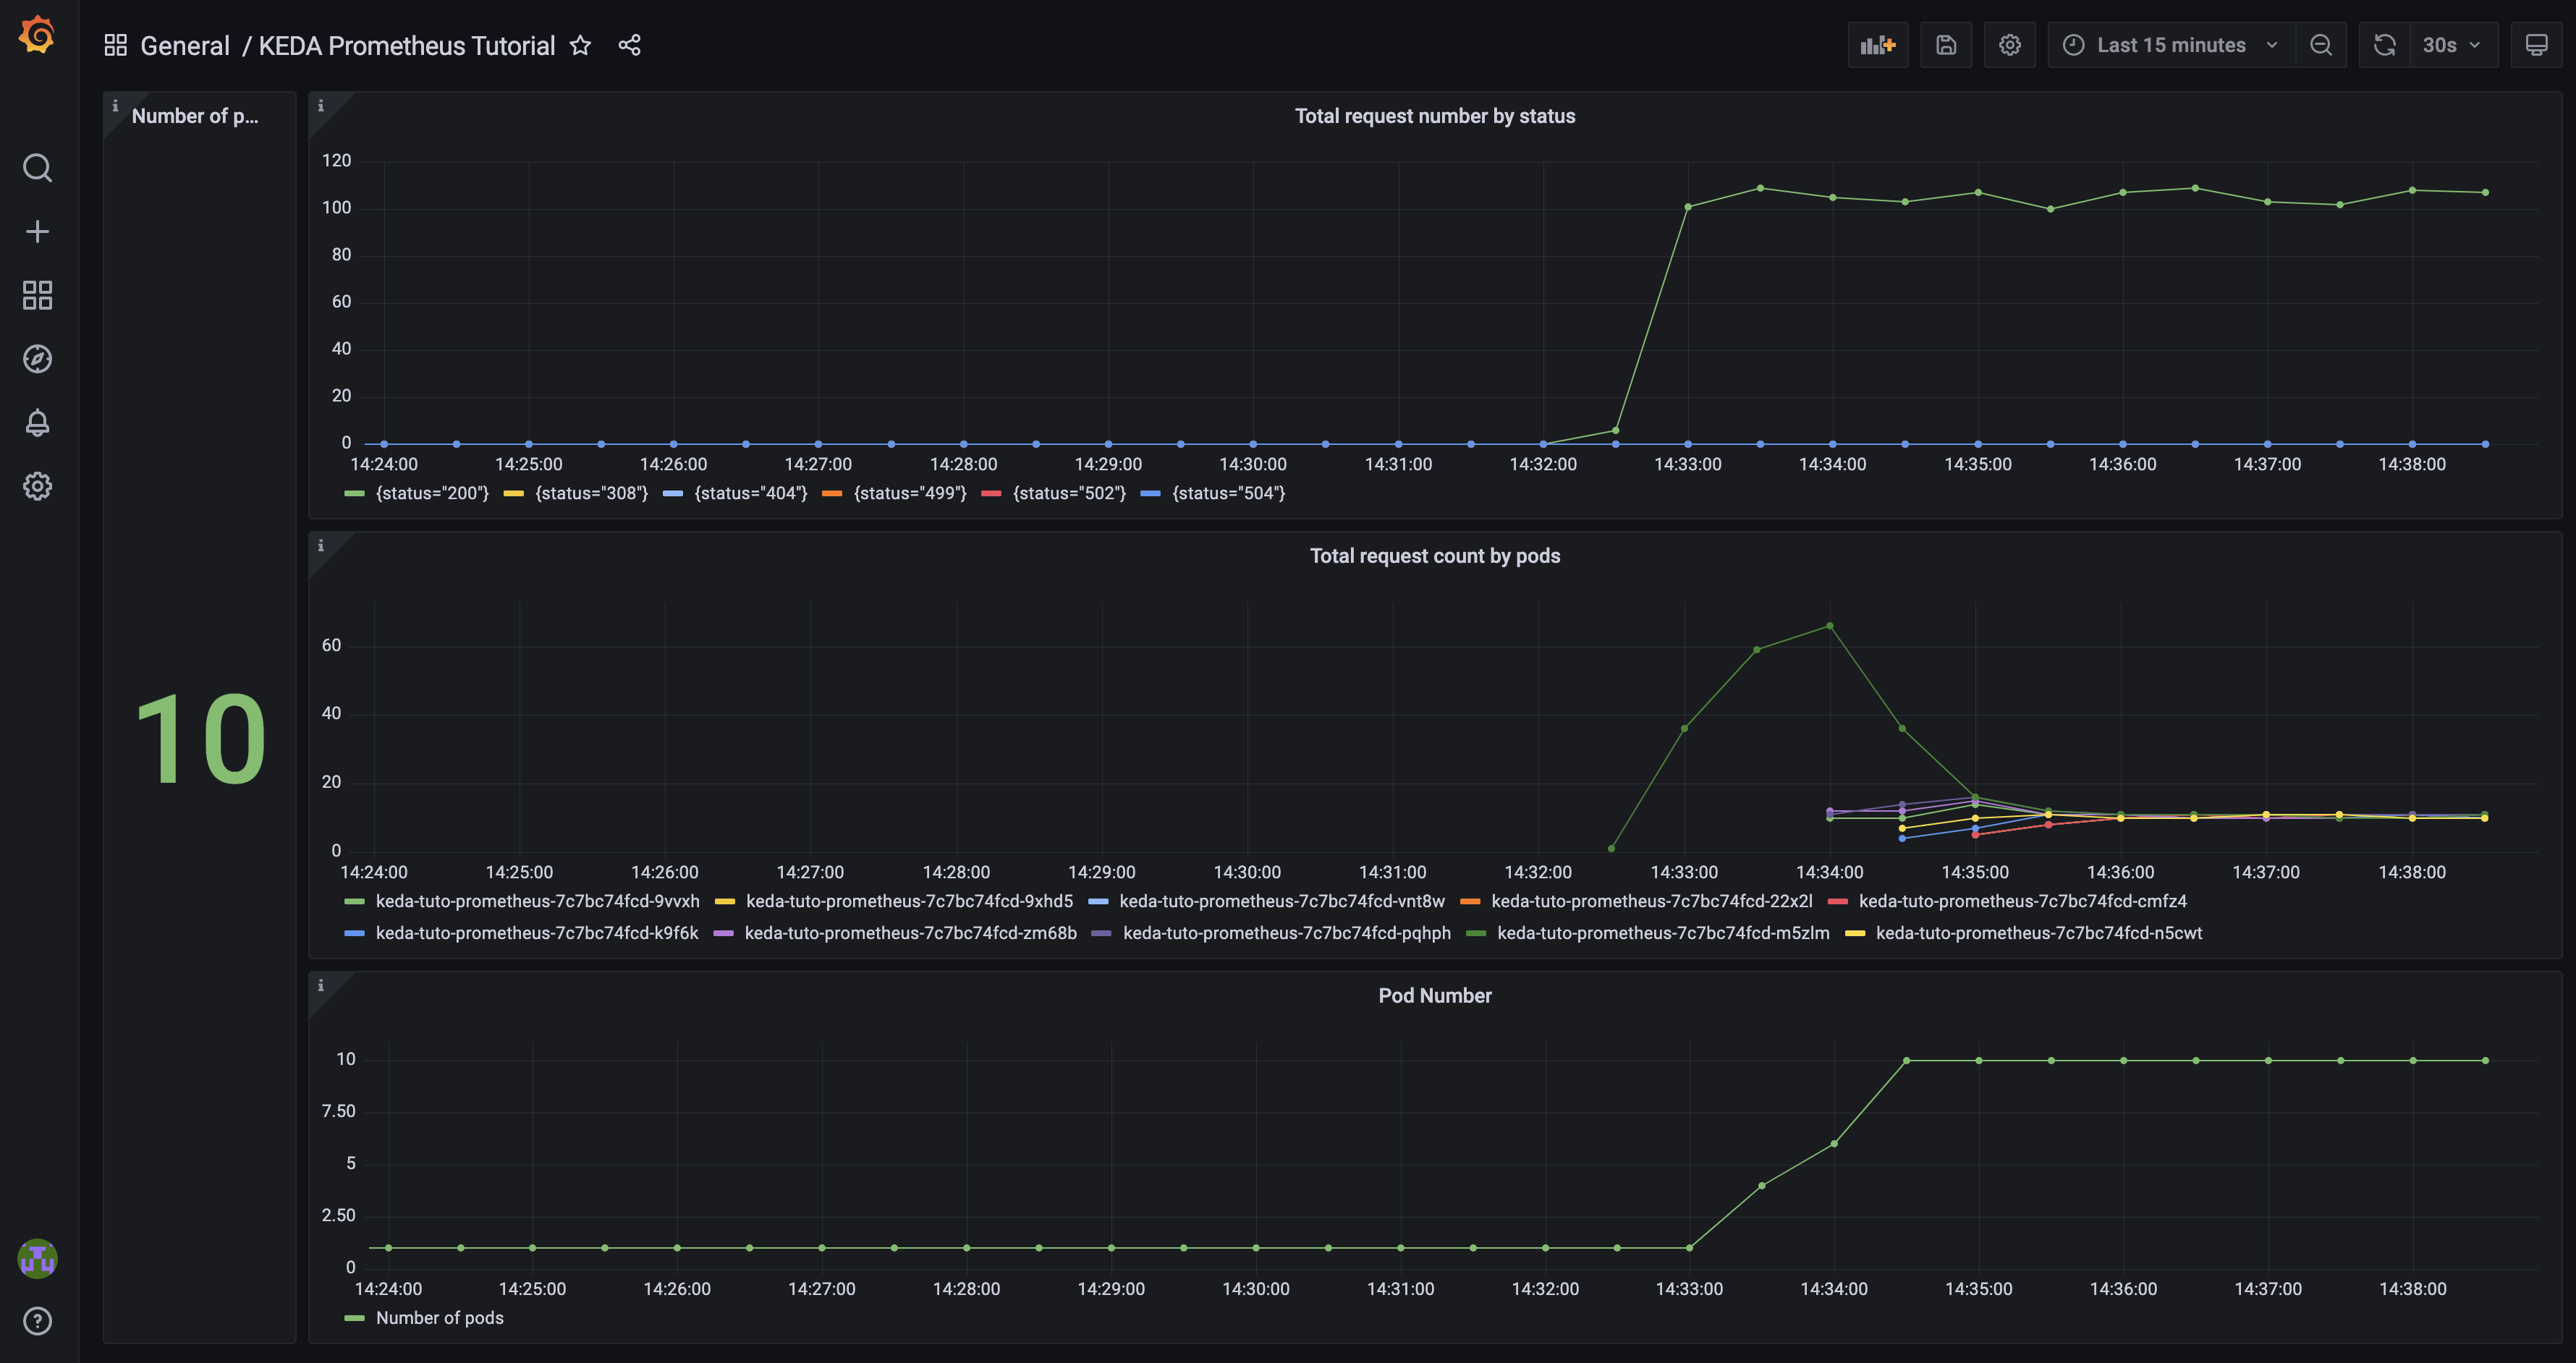
Great ! KEDA can effectively scale when the number of requests progressively increases. But what about facing a sudden burst of requests ?
Use vegeta to send 100 requests per seconds for 10 minutes straight:
echo "GET https://keda-tuto-prometheus.k8saas-k8saas-teh-259-sandbox.kaas.thalesdigital.io/" | vegeta attack -duration=600s -rate="105" -insecure | vegeta report --type=text
After a few minutes, KEDA react and scale up 10 pods directly :
Summary
The goal of the company was to be able to scale their application according to a custom metric: the rate of requests received by seconds.
KEDA is the perfect tool in this situation.
This use case has highlighted the efficiency and pertinence of use of KEDA with a common monitoring system as Prometheus. It scaled progressively according to an increasing amount of requests or scaled massively in response to a burst in the requests rate.
To go further :
- Play with the scaledObject file: changing the timeout, the polling interval, the max/min number of replicas,... ;
- Play with the PromQl query: Change the time window, ceil/floor/round the result,... ;
- Replicate this scenario using another common or custom metric in Prometheus.
Clean up
To delete the deployed resources, use the following commands:
kubectl delete -f kedatuto-prometheus-scaledobject.yaml
kubectl delete -f kedatuto-prometheus-servicemonitor.yaml
kubectl delete -f kedatuto-prometheus-deploy.yaml
kubectl delete secret regcred-af --namespace dev