PunchPlatform Tutorial
![]()
Introduction
In kubernetes it is possible to send commands using another identity within the cluster.
For example, if I were to execute a command as if I were the service account "k8saas-example-sa", I would do:
kubectl [...] --as=system:serviceaccount:dev:k8saas-example-sa.
However, user impersonation can be a real security threat as a cyber threat actors can use these identities to conduct malicious actions.
In this use case, we'll use Punchplatform to get information when a command using the user "k8saas-generic-sa-cicd" is run.
The kube-audit logs are kubernetes logs that gather information about the cluster actions.
In this scenario, we'll use the punch parsing capabilities to:
- listen to the kube-audit logs from Azure in real-time;
- parse and filter the logs;
- write to an Opensearch.
The ultimate goal being to see a pretty formatted log indexed in Opensearch every time a command is ran with user impersonation. Then we'll be able to use the Opensearch search engine to easily retrieve information about this logs, like the timestamp, usrAgent or source IP.
This test case demonstrate the capacities describe in the punchplatform parsing documentation.
Architecture
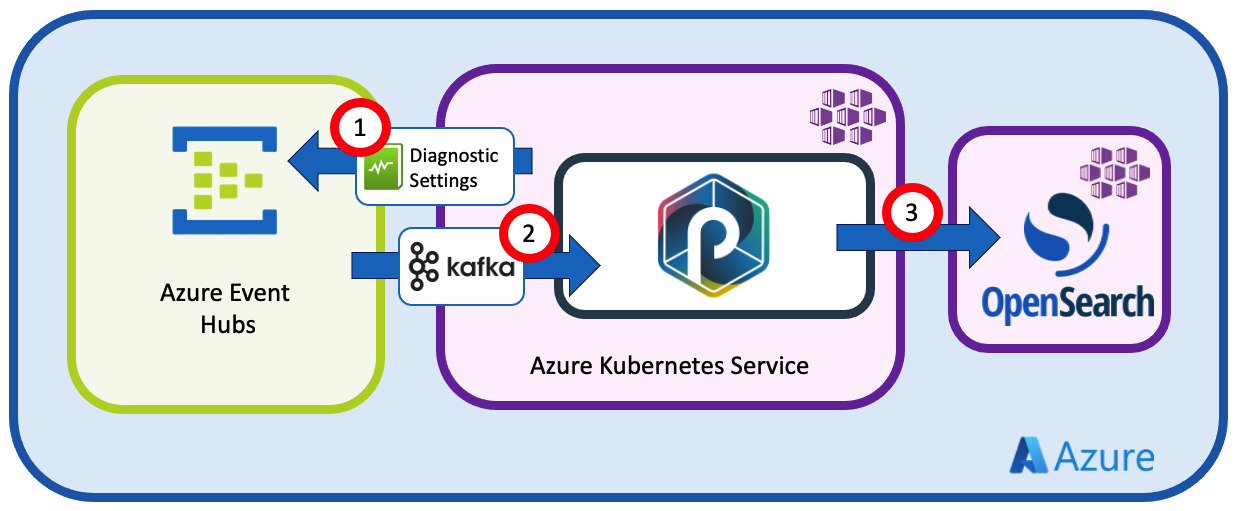
The kube-audit logs are only available on the kubernetes master nodes, and therefore, only Azure can gather them. However, we can use Azure Diagnostic Settings to ask them to send the logs to the Azure Event Hub instance.
Then, we'll configure the punchline :
- (1) to listen to Azure Event Hubs
- (2) to parse and filter the logs
- (3) to send the results to Opensearch
Requirements
You needs to submit two tickets via postit:
For Azure Event Hubs: "Something is missing"
- Ask for an Azure Event Hubs Namespace and Instance
- Ask to get your primary key for the Namespace
- Activate Diagnostic settings to route "Kube Audit" logs to the Azure Event Hubs
For Opensearch: "Subscribe to DBaaS Discover"
- Ask for a DBAAS Opensearch Instance
- Specify the need to whitelist your cluster external ip at Opensearch level
- Ask for an Opensearch user to write data to Opensearch
Punchline structure
The punchline respect the format of a Kubernetes yaml file.
The fields value are:
apiVersion: punchline.punchplatform.io/v2
kind: StreamPunchline
metadata:
  name: k8saas-punchline-sa-java
  labels:
    app: k8saas-punchline-sa-java
  annotations:
    # Enable Prometheus scraping
    prometheus.io/scrape: 'true'
    # Expose your metric on this port (can be any unused port)
    prometheus.io/port: '7770'
spec:
  containers:
    applicationContainer:
      image: ghcr.io/punchplatform/punchline-java:8.0.0
      imagePullPolicy: IfNotPresent
      env:
        - name: JDK_JAVA_OPTIONS
          value: "-Xms100m -Xmx450m"
  dag:
    ...
Then, the pipeline process is describe within the dag field. "dag" stands for "Directed acyclic graph" and is a list of nodes that will be executed in the specified order.
There are 3 kind of nodes:
- "source": input to gather data from;
- "function": to parse, enrich or filter the data;
- "sink": output to send the data to.
For each of the following steps we will add one or several node to the dag field.
Receive data from Event hubs
The first step of the process is to receive the logs from Azure Event Hubs.
To this end, we'll need to add an input node to the punchline:
  - id: input
    kind: source
    type: kafka_source
    settings:
      bootstrap.servers: <INSTANCE_NAME>.servicebus.windows.net:9093  # Event Hubs Namespace Name
      group.id: connect-cluster-group
      topics: <INSTANCE_NAME> # Event Hubs instance Name
      start_offset_strategy: latest
      value.format: string
      offset.metadata.max.bytes: 1024
      max.message.bytes: 20971520
      security.protocol: SASL_SSL
      sasl.mechanism: PLAIN
      sasl.jaas.config: org.apache.kafka.common.security.plain.PlainLoginModule required username="$ConnectionString" password="Endpoint=sb://<INSTANCE_NAME>.servicebus.windows.net/;SharedAccessKeyName=RootManageSharedAccessKey;SharedAccessKey=<SHARED_ACCESS_KEY>";
    out:
      - id: punchlet_split_record
        table: logs
        columns:
          - name: value
            type: string
This source will configure a Kafka consumer to listen to the logs from Azure Event Hubs.
Be sure to replace the following placeholder with you own value:
<INSTANCE_NAME>: your instance name. For example: k8saas-toto-sandbox<SHARED_ACCESS_KEY>: your Azure Event Hub access key. Your Access Key should have been sent to you after your Azure Event Hubs instance creation.
The important fieds are:
- id: unique id for the node
- kind: kind of punchline node
- type: type of source, here it is a kafka consumer
- Settings:
- bootstrap.servers: Event Hub Namespace url
- topics: Event Hub Instance name
- sasl.jaas.config: credentials to connect to Azure Event Hubs
- out: info about to which node send the data next
- id: id of the following node
- table/columns: punch table and columns in which the data is stored. For our kafka source, it is [logs][value]
The setting "start_offset_strategy" will define the consumer strategy to retrieve the logs form Azure Event Hubs. "latest" will only get the latest messages, where "earliest" will get all the messages from the earliest one in memory.
Parse data
To parse the data, Punch has it own parsing language. It is an intuitive and very powerful tool to parse, filter and enrich data in real-time.
These code blocks are stored in "punchlets".
For this scenario, we'll define two punchlets:
- split_records.punch: split the bulk messages received from Azure event Hubs into single messages
- azure_parsing_header.punch: parse and enrich every log
Punchlet to split records
Azure event hubs send messages in bulk, so the messages needs to be split into single log instance to be parsed later.
The punchlet split_records.punch is:
{
  // records field contains an Array
  // by putting this array in the fields, the second punchlet_node wil get all the record one by one
  for (Tuple t : [logs][value][records].asCollection()) {
    Tuple tmp = tuple();
    tmp:[logs][value] = t;
    root.add(tmp);
  }
}
The bulk messages from azure are in the variable [logs][value][records]. By iterating over them in a for loop, we can create a Tuple object for each log, and add it to the stream (root) so it may be consume independently by the next punchline node.
Reminder: In the punch language, the Tuple is the base object for every log. One log is always stored as a Tuple.
Punchlet to parse and enrich the logs
One the log finally in our hands, we can manipulate it to collect all important information.
THe log received from Azure event hub is a kube-audit log. The Azure event hub message looks like this:
{
    "ccpNamespace": "62e2b831fb25b000014a2ad8",
    "resourceId": "/SUBSCRIPTIONS/XXX-7ED8-4C24-A9A4-D7B4C65600E2/RESOURCEGROUPS/K8SAAS-XXX-SANDBOX/PROVIDERS/MICROSOFT.CONTAINERSERVICE/MANAGEDCLUSTERS/K8SAAS-XXX-SANDBOX",
    "Cloud": "AzureCloud",
    "Environment": "prod",
    "operationName": "Microsoft.ContainerService/managedClusters/diagnosticLogs/Read",
    "time": "2022-08-24T21:56:08.0000000Z",
    "UnderlayClass": "hcp-underlay",
    "category": "kube-audit",
    "UnderlayName": "hcp-underlay-eastus-cx-809",
    "properties": {
        "pod": "kube-apiserver-d76d49667-qq58b",
        "log": "{\"kind\":\"Event\",\"apiVersion\":\"audit.k8s.io/v1\",\"level\":\"Metadata\",\"auditID\":\"7293d441-XXX-4521-b5ea-a347ea0c7292\",\"stage\":\"ResponseComplete\",\"requestURI\":\"/apis/status.gatekeeper.sh/v1beta1?timeout=32s\",\"verb\":\"get\",\"user\":{\"username\":\"system:serviceaccount:kube-system:resourcequota-controller\",\"uid\":\"0743f75a-5a8f-4f82-bf95-17511c5d0054\",\"groups\":[\"system:serviceaccounts\",\"system:serviceaccounts:kube-system\",\"system:authenticated\"]},\"sourceIPs\":[\"172.31.22.105\"],\"userAgent\":\"kube-controller-manager/v1.22.11 (linux/amd64) kubernetes/3555818/system:serviceaccount:kube-system:resourcequota-controller\",\"responseStatus\":{\"metadata\":{},\"code\":200},\"requestReceivedTimestamp\":\"2022-08-24T21:56:08.274404Z\",\"stageTimestamp\":\"2022-08-24T21:56:08.275390Z\",\"annotations\":{\"authorization.k8s.io/decision\":\"allow\",\"authorization.k8s.io/reason\":\"RBAC: allowed by ClusterRoleBinding \\\"system:discovery\\\" of ClusterRole \\\"system:discovery\\\" to Group \\\"system:authenticated\\\"\"}}\n",
        "stream": "stdout"
    }
}
with the actual kube-audit log within the field propertied.log that looks like:
{
  {
    "auditID": "XXX-9940-4b96-95e4-90fd0164bd43",
    "requestReceivedTimestamp": "2022-10-25T16: 24: 10.427986Z",
    "objectRef": {
        "apiGroup": "apps",
        "apiVersion": "v1",
        "resource": "deployments",
        "namespace": "A"
    },
    "level": "Request",
    "kind": "Event",
    "verb": "list",
    "annotations": {
        "authorization.k8s.io/decision": "forbid",
        "authorization.k8s.io/reason": ""
    },
    "userAgent": "kubectl/v1.24.3 (darwin/amd64) kubernetes/aef86a9",
    "requestURI": "/apis/apps/v1/namespaces/A/deployments?limit=500",
    "responseStatus": {
        "reason": "Forbidden",
        "metadata": {},
        "code": 403,
        "status": "Failure"
    },
    "impersonatedUser": {
        "groups": [
            "system:serviceaccounts",
            "system:serviceaccounts:dev",
            "system:authenticated"
        ],
        "username": "system:serviceaccount:dev:k8saas-generic-sa-cicd"
    },
    "stageTimestamp": "2022-10-25T16: 24: 10.428650Z",
    "sourceIPs": [
        "XXX.170.131.52"
    ],
    "apiVersion": "audit.k8s.io/v1",
    "stage": "ResponseComplete",
    "user": {
        "groups": [
            "system:masters",
            "system:authenticated"
        ],
        "username": "masterclient"
    }
}
The field impersonatedUser is dynamic and only present if an alias as been used. We want to filter the logs depending on its presence.
The other important fields necessary for an investigation are:
- requestReceivedTimestamp: time of the command
- userAgent: request's userAgent
- requestURI: the requested URI
- sourceIP: request's source IP
The punchlet split_records.punch is:
{
  // init 2 tuples one for parsing and one for the output
  Tuple document = [logs][log];
  Tuple tmp = [logs][value];

  // keep initial message for forensics purpose
  document:[message] = tmp.toString();
  // keep data when receiving the logs by kast-data
  document:[rep][ts] = date("yyyy-MM-dd'T'HH:mm:ssZ").get();

  // parse azure resource id
  String[] split = tmp:[resourceId].split("/");
  document:[azure][subscription][id] = split[2];
  document:[azure][resource_group][name] = split[4].toLowerCase();
  document:[azure][service] = "aks";
  document:[k8saas][instance][name] = split[8].toLowerCase();

  document:[obs][ts] = tmp:[ts];

  document:[app][name] = tmp:[category];

  document:[audit][pod][name] = tmp:[properties][pod];

  String logMsg = tmp:[properties][log];
  logMsg = logMsg.replace('\"', '"').replace("\n", "").replace("\r", "");
  Tuple tmplogs = TupleFactory.getTupleFromJson(logMsg);
  document:[audit][log] = tmplogs.toString();
  document:[audit][user][username] = tmplogs:[user][username];
  document:[audit][user][groups] = tmplogs:[user][groups];
  document:[audit][sourceIPs] = tmplogs:[sourceIPs];
  document:[audit][userAgent] = tmplogs:[userAgent];
  document:[audit][requestReceivedTimestamp] = tmplogs:[requestReceivedTimestamp];

  if (tmplogs.hasKey("impersonatedUser")) {
    document:[audit][impersonatedUser][username] = tmplogs:[impersonatedUser][username];
    document:[audit][impersonatedUser][groups] = tmplogs:[impersonatedUser][username];
  } else {
    document:[audit][impersonatedUser][username] = "";
    document:[audit][impersonatedUser][groups] = "";
  }

  if (document:[audit][impersonatedUser][username].contains("k8saas-generic-sa-cicd")) {
    [logs][document] = document;
  }
}
Here we use two tuple along the process. The Tuple tmp contain the raw log from Azure Event Hubs, where document contains the final output log.
Then all the lines except for last three are dedicated to parse every field.
At the end, the last if condition is here to filter all logs and only keeps the one that contains a field impersonatedUser with the value "k8saas-generic-sa-cicd".
The output logs contains all relevant information parsed from the original logs and the original kube-audit logs in raw text in the "message" field.
Here is an example of output log once parsed:
{
    "app": {
        "name": "kube-audit"
    },
    "audit": {
        "requestReceivedTimestamp": "2022-10-28T20:23:38.028442Z",
        "sourceIPs": [
            "70.81.XXX.111"
        ],
        "pod": {
            "name": "kube-apiserver-7c8db89564-vjhmg"
        },
        "log": "{...}",
        "userAgent": "k9s/v0.0.0 (darwin/amd64) kubernetes/$Format","user": {
            "groups": [
                "system:masters",
                "system:authenticated"
            ],
            "username": "masterclient"
        },
        "impersonatedUser": {
            "groups": "",
            "username": ""
        }
    },
    "message": "{...}",
    "rep": {
        "ts": "2022-10-28T20:24:20+0000"
    },
    "k8saas": {
        "instance": {
            "name": "k8saas-XXX-sandbox"
        }
    },
    "azure": {
        "resource_group": {
            "name": "k8saas-XXX-sandbox"
        },
        "service": "aks",
        "subscription": {
            "id": "XXX-7ED8-4C24-A9A4-D7B4C65600E2"
        }
    }
}
Implementation of the punchlets in punchline nodes
Now that our punchlets are ready, they will be mounted in a dedicated configmap when it's time to deploy the solution on kube.
For the moment, let's see the new punchline node that calls these punchlets:
- id: punchlet_split_record
  kind: function
  type: punchlet_function
  settings:
    punchlets:
      - /resources/split_records.punch
  out:
    - id: punchlet_parse_log
      table: logs
      columns:
        - name: value
          type: string
- id: punchlet_parse_log
  kind: function
  type: punchlet_function
  settings:
    punchlets:
      - /resources/azure_parsing_header.punch
  out:
    - id: elastic_sink
      table: logs
      columns:
        - name: document
          type: string
Each node configuration is straight forward:
- kind is "function"
- type is "punchlet function"
- settings.punchlet is the path to one of the mounted punchlets
The final output points to the elasticsearch sink node.
Write to Opensearch
We wants to analyze the parsed logs within Opensearch. To do so, we'll set up a output node that writes into an elastic index.
Here is the punchline node:
      - id: elastic_sink
        kind: sink
        type: elasticsearch
        engine_settings:
          tick_row_frequency_ms: 1000
        settings:
          http_hosts:
            - host: elasticsearch.esaas-<ESAAS_INSTANCE_NAME>.kaas.thalesdigital.io
              port: 443
              scheme: https
          security:
            credentials:
              username: "<OPENSEARCH_USER>"
              password: "<OPENSEARCH_PASSWORD>"
          index:
            type: constant
            value: k8saas-kast-audit-<INSTANCE_NAME>
          document:
            json_column: document
Please replace:
<INSTANCE_NAME>: name of your cluster<ESAAS_INSTANCE_NAME>: name of your elastic cluster instance<OPENSEARCH_USER>: Opensearch user name, given at cluster creation<OPENSEARCH_PASSWORD>: Opensearch user password, given at cluster creation
Run the punchline in Kubernetes
To run the punchline in kube, there are 3 different files:
- the deployment of the punchlets configmap
- the deployment of the punchline configmap
- the deployment of Punch application
First, both of the punchlets are added to a configmap: k8saas-punch-audit-punchlets-cm.yaml:
apiVersion: v1
kind: ConfigMap
metadata:
  name: k8saas-punch-audit-punchlets-cm
data:
  split_records.punch: |
    {
      // records field contains an Array
      // by putting this array in the fields, the second punchlet_node wil get all the record one by one
      for (Tuple t : [logs][value][records].asCollection()) {
        Tuple tmp = tuple();
        tmp:[logs][value] = t;
        root.add(tmp);
      }
    }
  azure_parsing_header.punch: |
    {
      // init 2 tuples one for parsing and one for the output
      Tuple document = [logs][log];
      Tuple tmp = [logs][value];

      // keep initial message for forensics purpose
      document:[message] = tmp.toString();
      // keep data when receiving the logs by kast-data
      document:[rep][ts] = date("yyyy-MM-dd'T'HH:mm:ssZ").get();

      // parse azure resource id
      String[] split = tmp:[resourceId].split("/");
      document:[azure][subscription][id] = split[2];
      document:[azure][resource_group][name] = split[4].toLowerCase();
      document:[azure][service] = "aks";
      document:[k8saas][instance][name] = split[8].toLowerCase();

      document:[obs][ts] = tmp:[ts];

      document:[app][name] = tmp:[category];

      document:[audit][pod][name] = tmp:[properties][pod];

      String logMsg = tmp:[properties][log];
      logMsg = logMsg.replace('\"', '"').replace("\n", "").replace("\r", "");
      Tuple tmplogs = TupleFactory.getTupleFromJson(logMsg);
      document:[audit][log] = tmplogs.toString();
      document:[audit][user][username] = tmplogs:[user][username];
      document:[audit][user][groups] = tmplogs:[user][groups];
      document:[audit][sourceIPs] = tmplogs:[sourceIPs];
      document:[audit][userAgent] = tmplogs:[userAgent];
      document:[audit][requestReceivedTimestamp] = tmplogs:[requestReceivedTimestamp];

      if (tmplogs.hasKey("impersonatedUser")) {
        document:[audit][impersonatedUser][username] = tmplogs:[impersonatedUser][username];
        document:[audit][impersonatedUser][groups] = tmplogs:[impersonatedUser][username];
      } else {
        document:[audit][impersonatedUser][username] = "";
        document:[audit][impersonatedUser][groups] = "";
      }

      if (document:[audit][impersonatedUser][username].contains("k8saas-generic-sa-cicd")) {
        [logs][document] = document;
      }

      // print(tmp);
      // print(document);
    }
Then,the punchline is added to a configmap: k8saas-punch-audit-punchline-cm.yaml:
apiVersion: v1
kind: ConfigMap
metadata:
  name: k8saas-punch-audit-punchline-cm
data:
  punchline.yml: |
    apiVersion: punchline.punchplatform.io/v2
    kind: StreamPunchline
    metadata:
      name: k8saas-punchline-sa-java
      labels:
        app: k8saas-punchline-sa-java
      annotations:
        # Enable Prometheus scraping
        prometheus.io/scrape: 'true'
        # Expose your metric on this port (can be any unused port)
        prometheus.io/port: '7770'
    spec:
      containers:
        applicationContainer:
          image: ghcr.io/punchplatform/punchline-java:8.0.0
          imagePullPolicy: IfNotPresent
          env:
            - name: JDK_JAVA_OPTIONS
              value: "-Xms100m -Xmx450m"
      dag:
      - id: input
        kind: source
        type: kafka_source
        settings:
          bootstrap.servers: <INSTANCE_NAME>.servicebus.windows.net:9093  # Event Hubs Namespace Name
          group.id: connect-cluster-group
          topics: <INSTANCE_NAME> # Event Hubs instance Name
          start_offset_strategy: latest
          value.format: string
          offset.metadata.max.bytes: 1024
          max.message.bytes: 20971520
          security.protocol: SASL_SSL
          sasl.mechanism: PLAIN
          sasl.jaas.config: org.apache.kafka.common.security.plain.PlainLoginModule required username="$ConnectionString" password="Endpoint=sb://<INSTANCE_NAME>.servicebus.windows.net/;SharedAccessKeyName=RootManageSharedAccessKey;SharedAccessKey=<SHARED_ACCESS_KEY>";
        out:
          - id: punchlet_split_record
            table: logs
            columns:
              - name: value
                type: string
      - id: punchlet_split_record
        kind: function
        type: punchlet_function
        settings:
          punchlets:
            - /resources/split_records.punch
        out:
          - id: punchlet_parse_log
            table: logs
            columns:
              - name: value
                type: string
      - id: punchlet_parse_log
        kind: function
        type: punchlet_function
        settings:
          punchlets:
            - /resources/azure_parsing_header.punch
        out:
          - id: elastic_sink
            table: logs
            columns:
              - name: document
                type: string
      - id: elastic_sink
        kind: sink
        type: elasticsearch
        engine_settings:
          tick_row_frequency_ms: 1000
        settings:
          http_hosts:
            - host: elasticsearch.esaas-teh-esaas-b243-sandbox.kaas.thalesdigital.io
              port: 443
              scheme: https
          security:
            credentials:
              username: "<OPENSEARCH_USER>"
              password: "<OPENSEARCH_PASSWORD>"
          index:
            type: constant
            value: k8saas-punch-audit-teh-b262-20221024
          document:
            json_column: document
Finally both configmap are mounted with a deployment that will run the application: k8saas-punch-audit-dpl.yaml:
apiVersion: apps/v1
kind: Deployment
metadata:
  name: k8saas-punch-audit-dpl
  labels:
    app: k8saas-punch-audit-pod
  annotations:
    fluentbit.io/exclude: "true"
spec:
  replicas: 1
  selector:
    matchLabels:
      app: k8saas-punch-audit-pod
  template:
    metadata:
      labels:
        app: k8saas-punch-audit-pod
      annotations:
        fluentbit.io/exclude: "true"
    spec:
      containers:
        - name: punchline
          image: ghcr.io/punchplatform/punchline-java:8.0.0
          imagePullPolicy: Always
          args: ["/punchline.yml"]
          ports:
            - name: metrics
              containerPort: 7770
          volumeMounts:
            - name: punchline
              mountPath: /punchline.yml
              subPath: punchline.yml
            - name: punchlets
              mountPath: /resources
      volumes:
        - name: punchline
          configMap:
            name: k8saas-punch-audit-punchline-cm
        - name: punchlets
          configMap:
            name: k8saas-punch-audit-punchlets-cm
Then, just apply the three files in the dev namespace:
kubectl apply -f k8saas-punch-audit-punchlets-cm.yaml -n dev
kubectl apply -f k8saas-punch-audit-punchline-cm.yaml -n dev
kubectl apply -f k8saas-punch-audit-deploy.yaml -n dev
And check that the deployment is successful:
kubectl get configmaps -n dev
# NAME                              DATA   AGE
# k8saas-punch-audit-punchlets-cm   2      10s
# k8saas-punch-audit-punchline-cm   1      10s
kubectl get pods -n dev
# NAME                                      READY   STATUS    RESTARTS        AGE
# k8saas-punch-audit-dpl-7fdb87fdbf-p5gs8   2/2     Running   0               10s
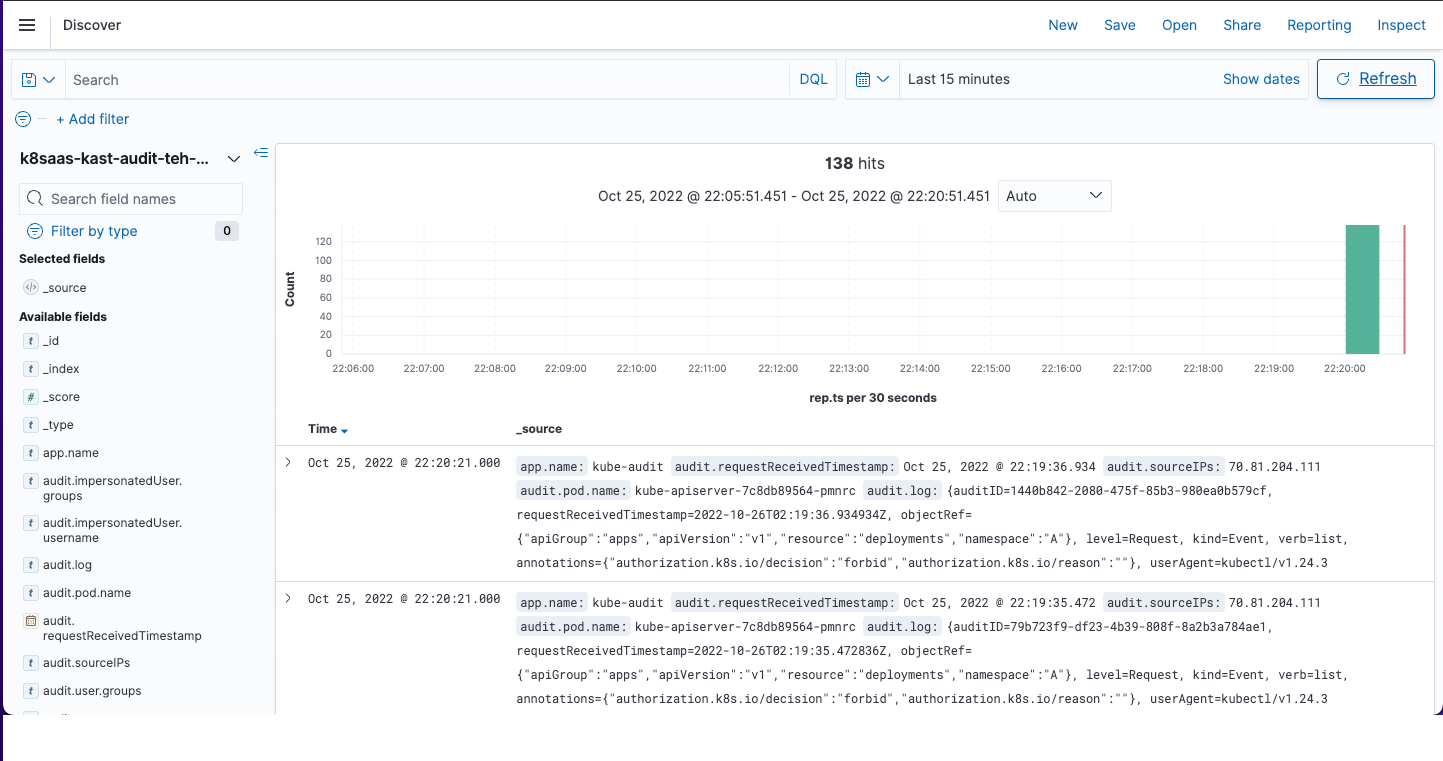
How to test
Run the following commands in your cluster:
for i in {1..100}; do kubectl get deploy --as=system:serviceaccount:dev:k8saas-generic-sa-cicd -n dev; done
for i in {1..100}; do kubectl get deploy --as=system:serviceaccount:dev:k8saas-generic-sa-cicd -n A; done
Do not worry if errors appears on the screen, the idea is just to generate some logs with the use of the service account k8saas-generic-sa-cicd.
Then, a few minutes later, they should appears in Opensearch:
Monitoring
There are two Grafana dashboard that Punchplatform provides to monitor your punchlines:
- Punch Advanced Insights
- Punch Ack Fail Rates
Punch Advanced Insights Dashboard
This dashboard displays information about:
- the CPU consumption of every punchline node individually
- pending rows
- the total traversal time over time
You can import it in Grafana using the following json file: punch_ack_fail_rates_dashboard.json
Here is a view of the dashboard during the execution of the scenario:
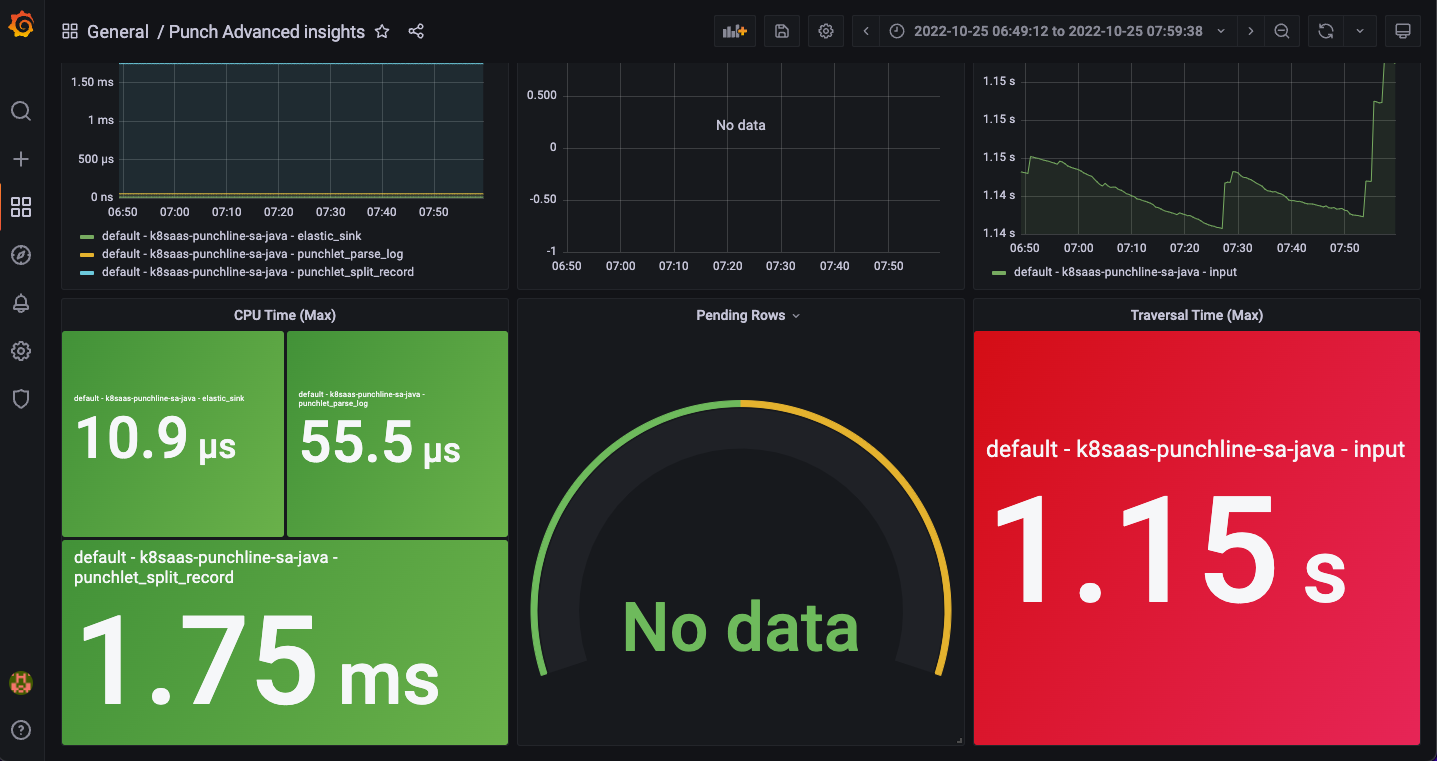
As we can see information per node, it is easy to see any malfunction within the dag. For example, we sent the wrong log field to the Elasticsearch node at some point, and this field was filtered out somewhere else in a punchlet. Then we can easily see with the dashboard that the node is not active.
Punch Ack Failed Rates
Ack stands for "acknowledgment". It means that the log message from Azure event hubs as been successfully processed at every step.
This dashboard displays information about:
- the evolution of acks per seconds over time per punchline nodes
- the evolution of fails per seconds over time per punchline nodes
- the fail rate
- the acks rate
- a summary of these information by node
You can import this dashboard in Grafana using the following json file: punch_ack_fail_rates_dashboard.json
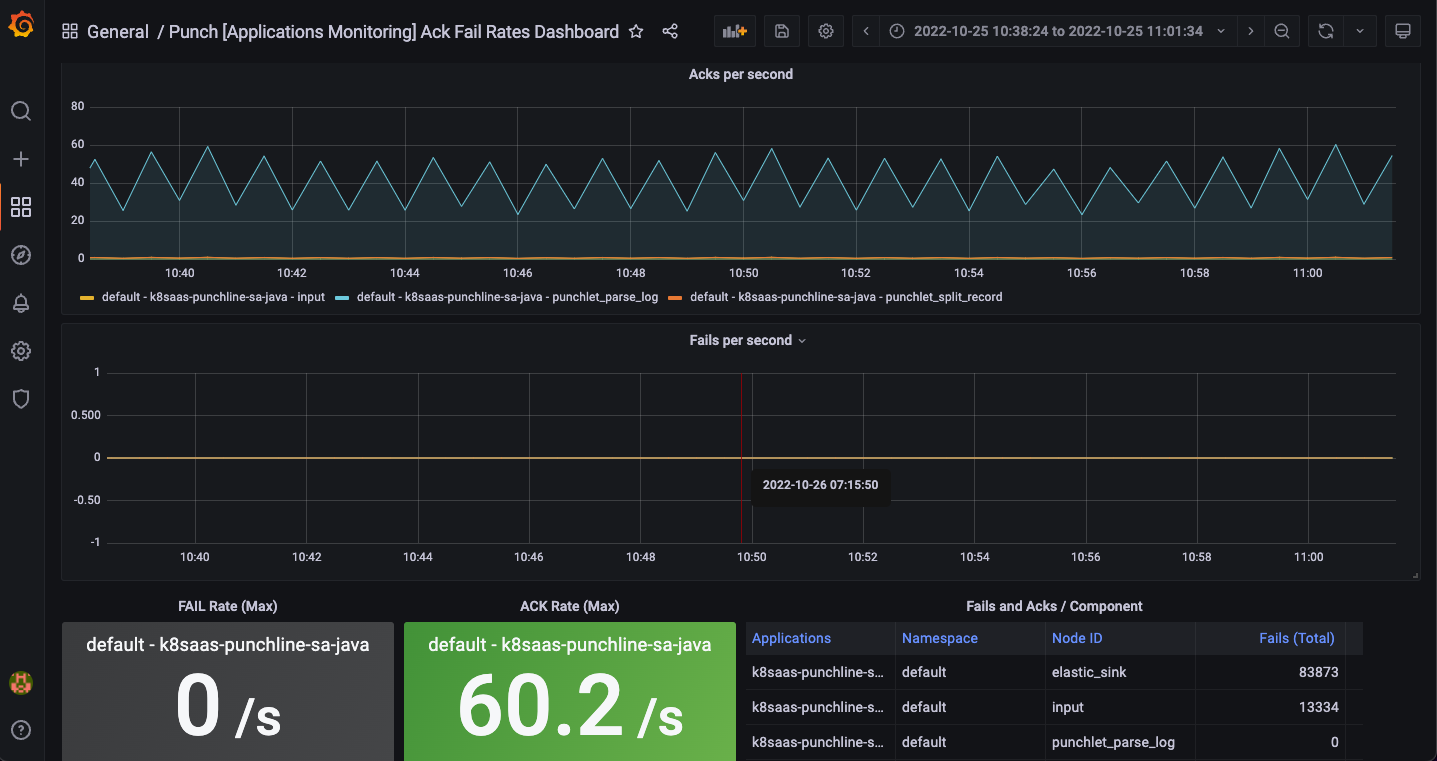
This dashboard is really useful to quickly have a summary of all failure happened and at which node. The spikes we see on the screenshot matches to the reception of AZure Event Hubs bulk messages.